Ninja
Ninja
Dashboard Ninja with AI
Create amazing reports with the powerful & smart Odoo
Dashboard Ninja app with a
refreshed, modern user interface for effortless navigation
and enhanced user
experience. Enjoy the simplified workflow that makes
everything easy, from
generating dashboards to collaborating with your team
members.


Latest Release 1.1.7
7th April, 2025
What’s New in Dashboard Ninja
New Theme
Extract Chart Insights with AI
Bookmark Dashboard
Internal Chat
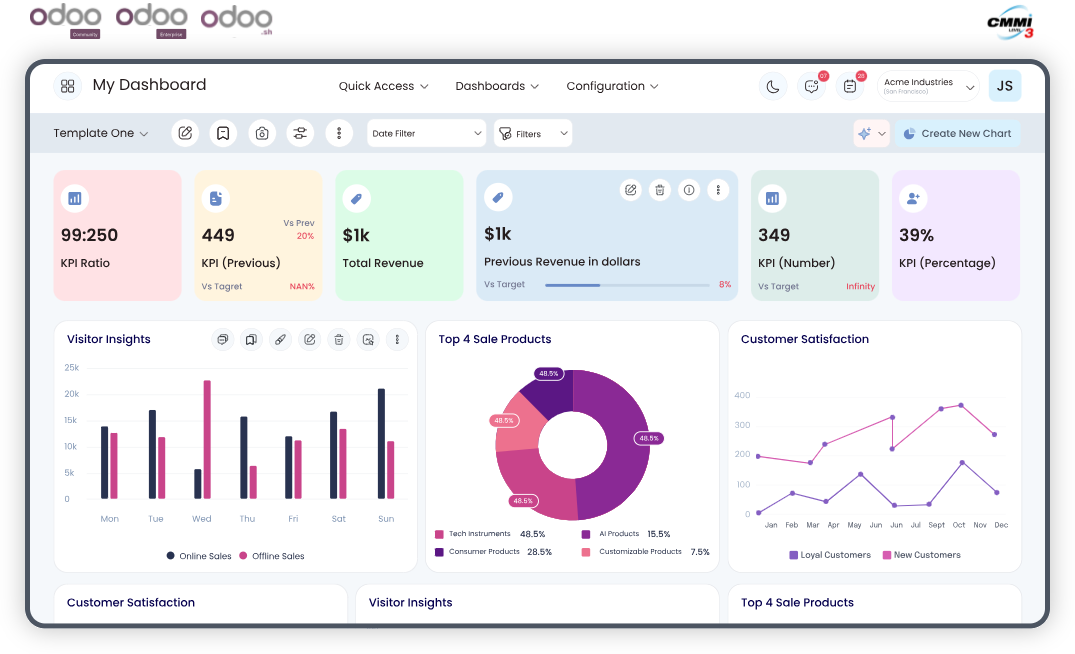
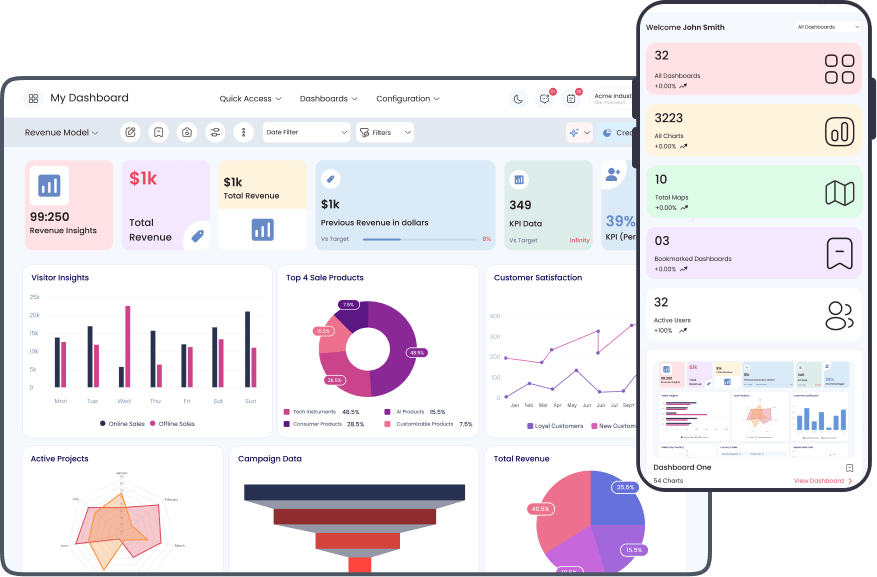
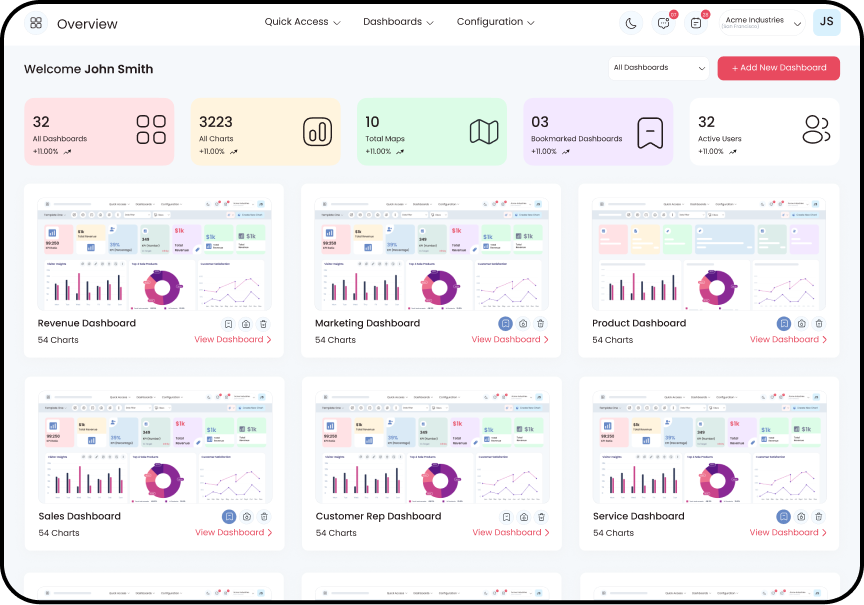
Dashboard Overview
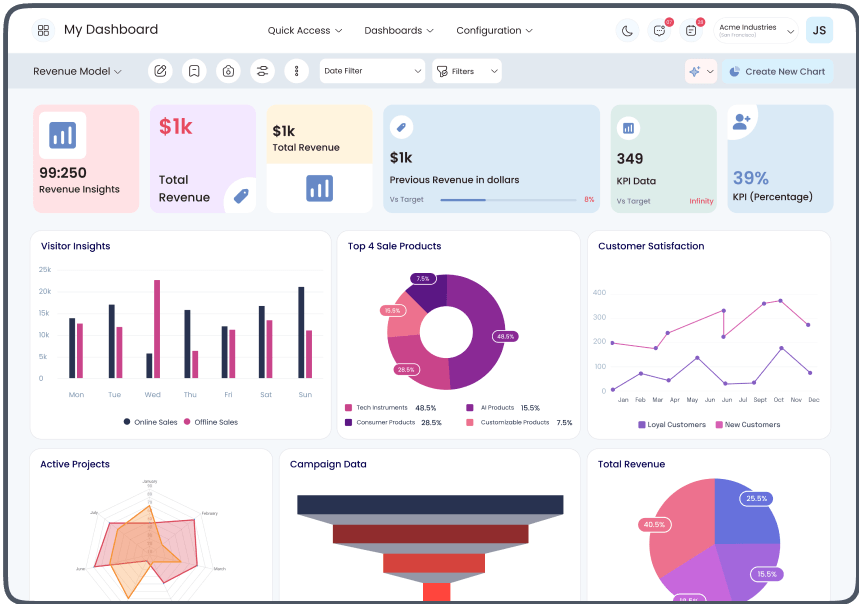
Chart Visualization
Empower your business with Odoo Best Dashboard
tools—customized, insightful, and ready to scale.

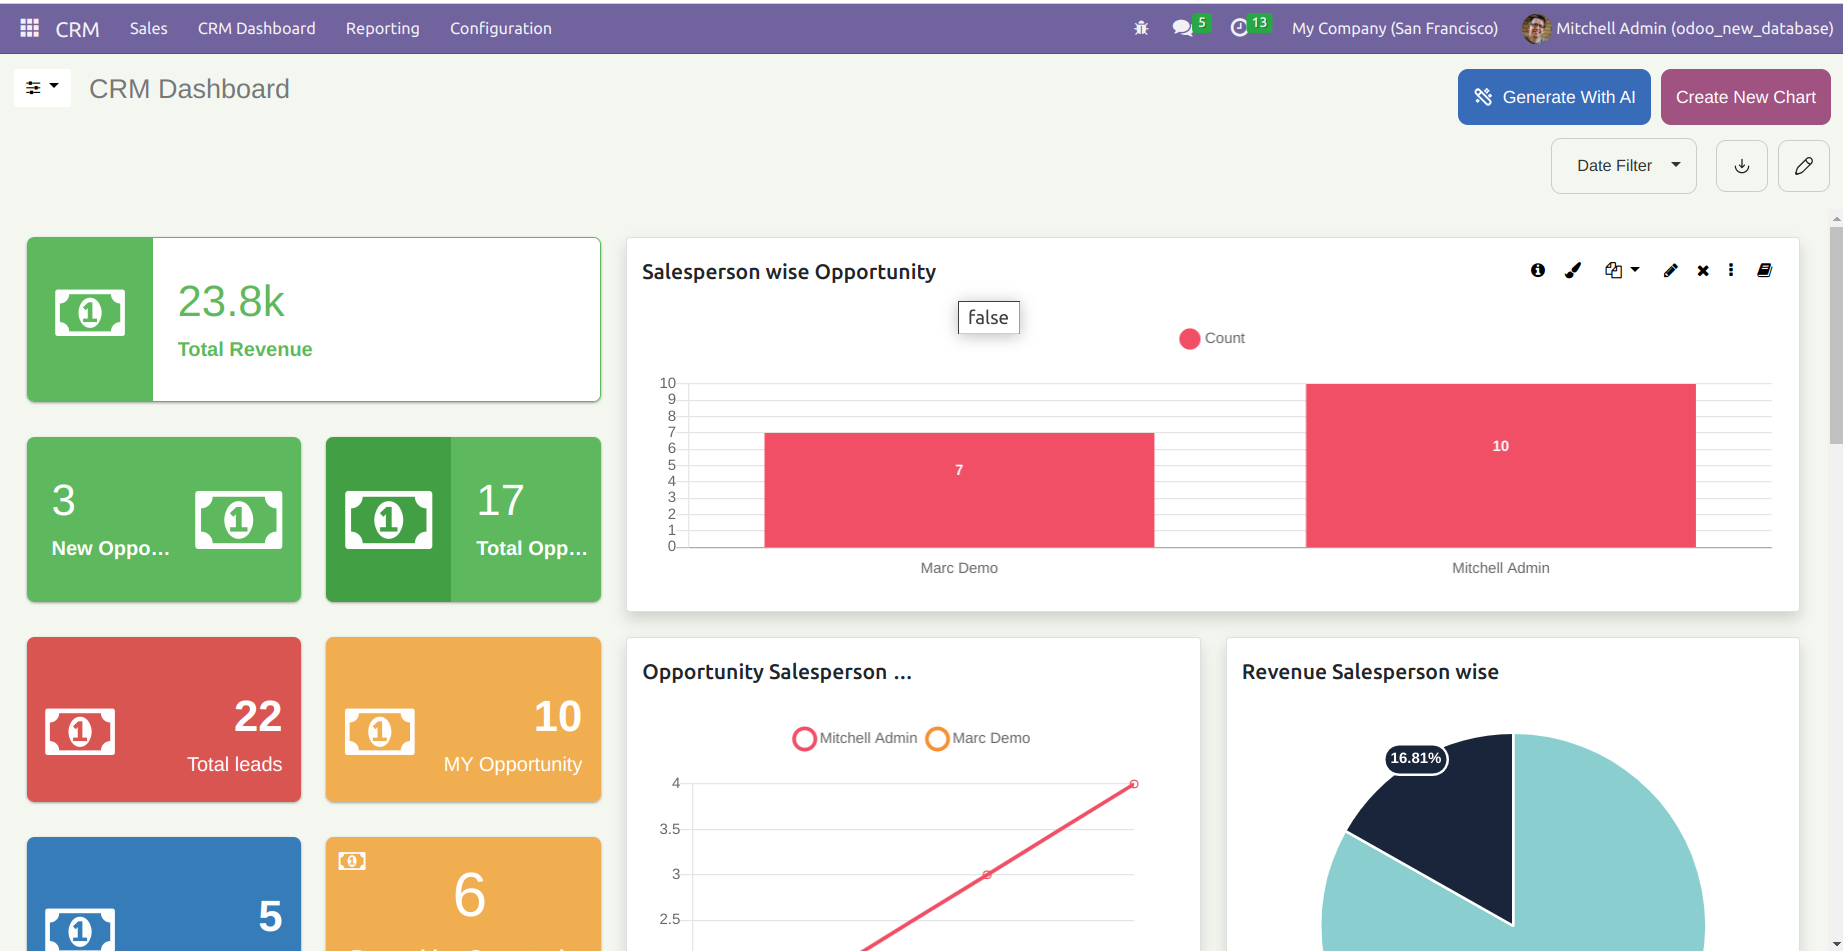
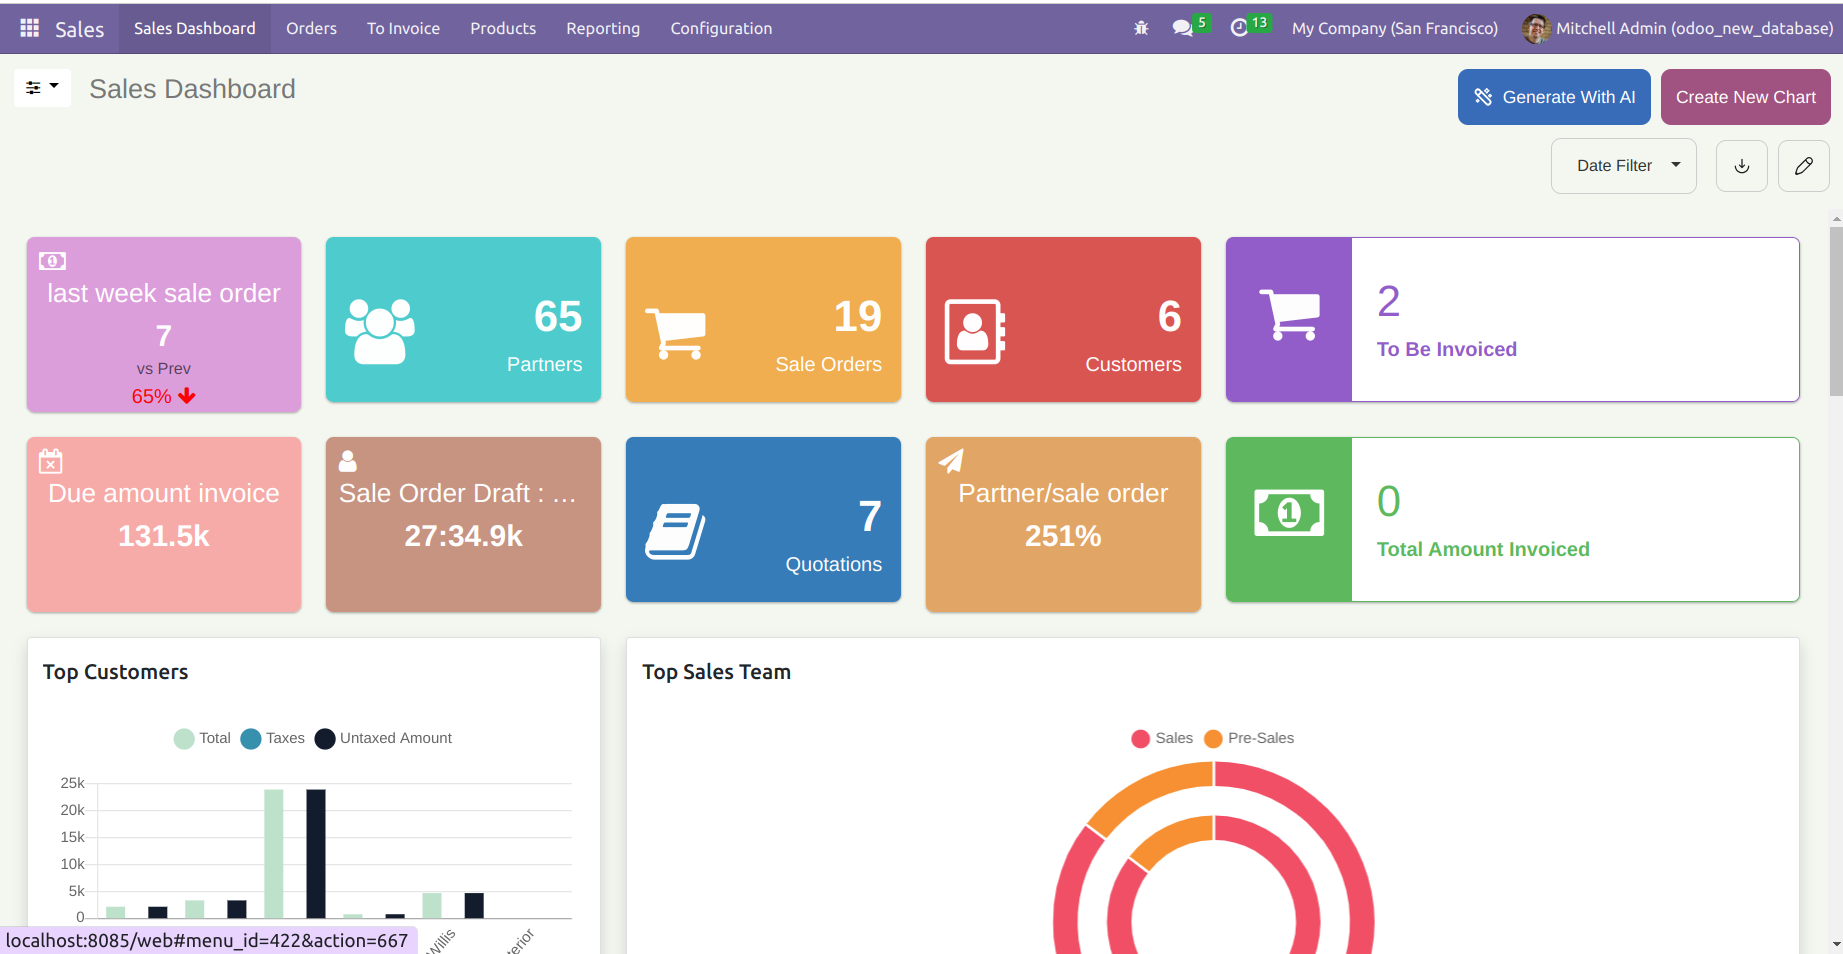
- Track sales with Sales Dashboard and revenue trends.
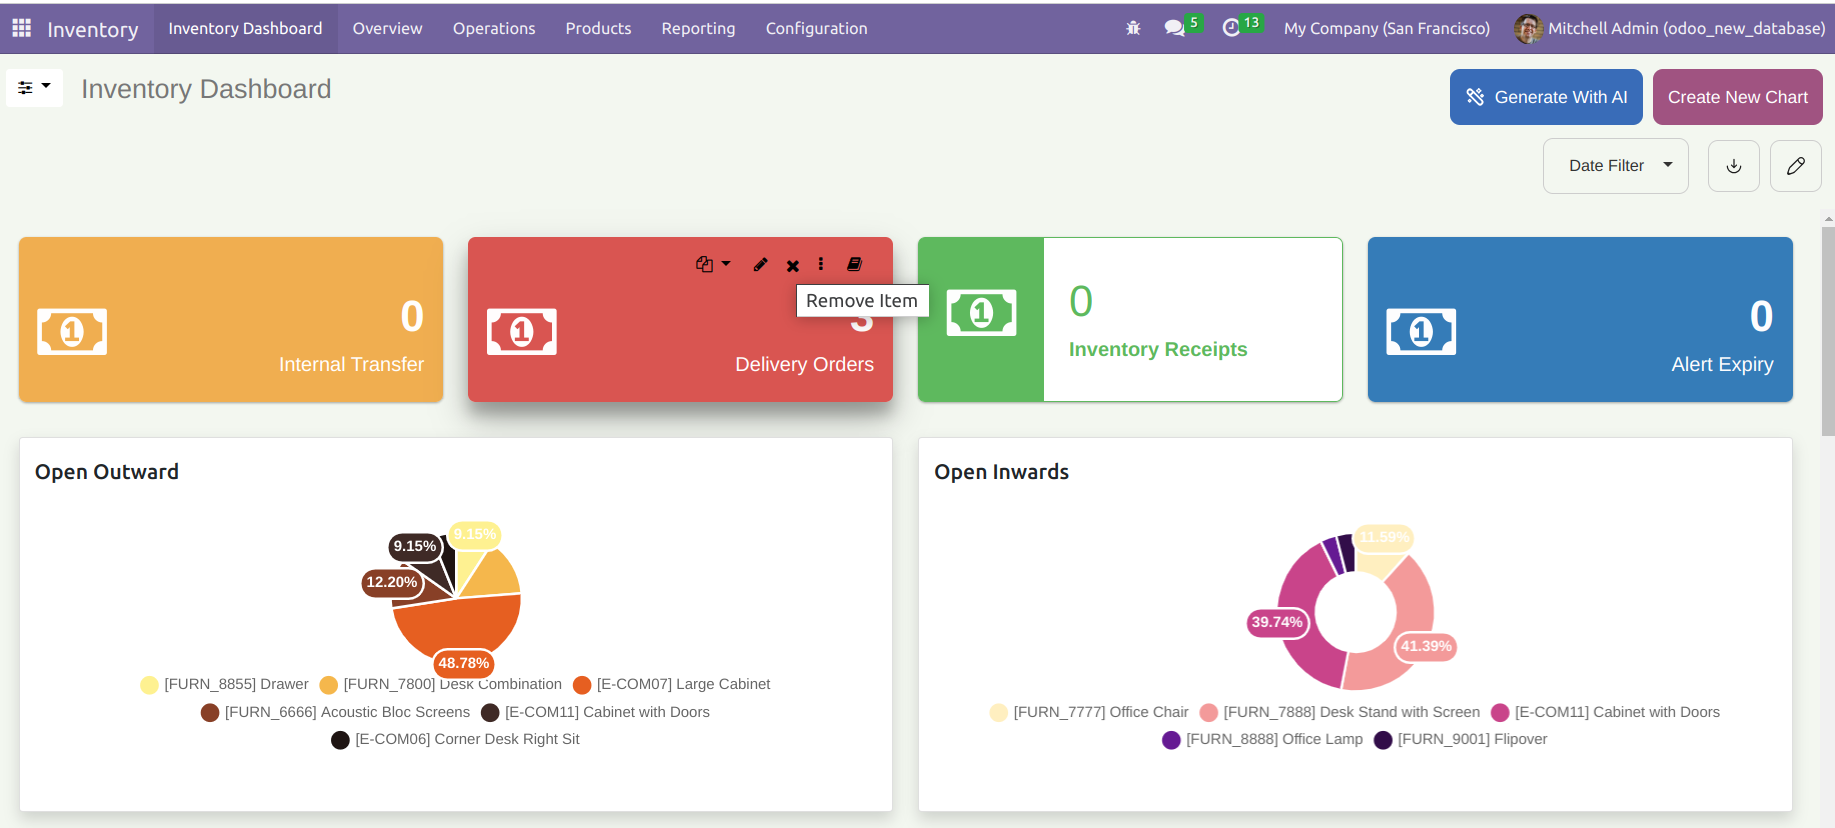
- Monitor stock using Inventory Dashboard.
- Analyze customer data via Analytic Dashboard.
- Create Multiple Dashboards for stores and channels.

- Measure production KPIs in an Advance Dashboard.
- Manage stock with Accounting Stock Dashboard.
- Analyze defects via Chart Graphs Table View.
- Use a Customized Robust Dashboard for supply chain tracking.

- Visualize appointments using a Beautiful Dashboard.
- Monitor medical inventory with Inventory Dashboard.
- Track billing via Invoice Dashboard.
- Manage staff through a Modern Dashboard.

- View financials in an Account Dashboard.
- Track invoices through an Invoice Dashboard.
- Monitor ROI with Odoo Best Dashboard.
- Build Pre-Configured Dashboards for audits.

- Review student data with an Analytic Dashboard.
- Track attendance in a Predefined Dashboard.
- Analyze leads via CRM Dashboard.
- Use a Beautiful Powerful Dashboard for faculty KPIs.

- Analyze leads using Odoo Dashboard.
- Track visits in a Best Ninja Dashboard.
- Use Beautiful Dashboards for sales insights.
- Create a Dashboard Studio for agents.

- Track delivery with a Dynamic Dashboard.
- Monitor routes via Chart Graphs Table View.
- View fuel data in a Robust Dashboard.
- Combine KPIs using Multiple Dashboards.

- Track bookings using CRM Dashboard.
- Analyze revenue via a Sales Dashboard.
- Monitor campaigns in a Revamp Dashboard.
- Build a Customized Dashboard per property.

- Track sprints in an Advance Dashboard.
- Monitor users via Analytic Dashboard.
- View support KPIs with Odoo Studio.
- Build an All-In-One Dynamic Dashboard.

- View donations in a Predefined Dashboard.
- Track volunteers through a Customized Robust Dashboard.
- Analyze campaigns using a Pie Chart Dashboard.
- Share results with a Beautiful Powerful Dashboard.

- Manage content pipelines with a Dynamic Dashboard.
- Track ad revenue using Sales Dashboard.
- Monitor user engagement with Analytic Dashboards.
- Build Customized Dashboards for streaming, publishing, or events.

- Track case progress with a Modern Dashboard.
- Monitor billable hours via Invoice Dashboard.
- Manage documentation through a Predefined Dashboard.
- Ensure regulatory compliance using a Customized Robust Dashboard.
Ksolves - Your
one-stop
solution
We are available 24/7 for your service. Contact us today!
Dashboard Ninja Charts
Supports 17 impressive Odoo dashboard item types for easy business data interpretation. (Tiles, Line Chart, List View, Bar Chart, Horizontal Bar Chart, Area Chart, To-do Item, Polar Area Chart, Pie Chart, Doughnut Charts, Flower Chart, Funnel Chart, Radial Chart, Radar Chart, Scatter Chart, Bullet Chart & Map view)

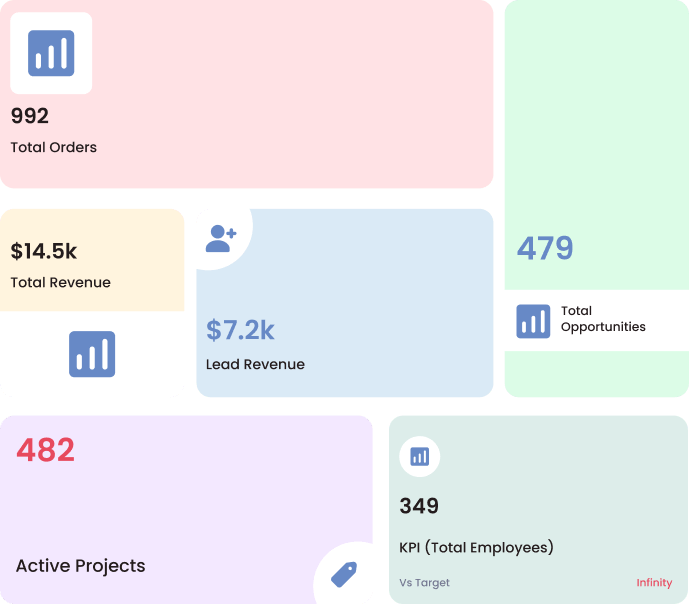
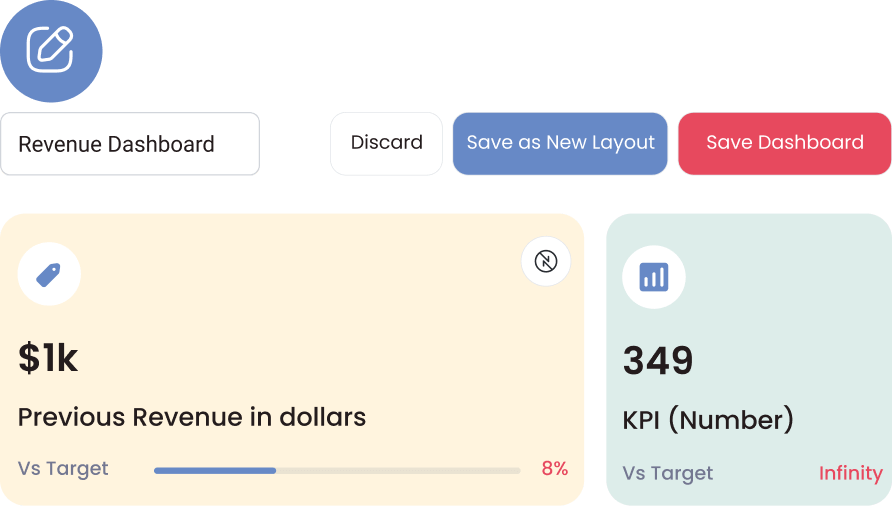
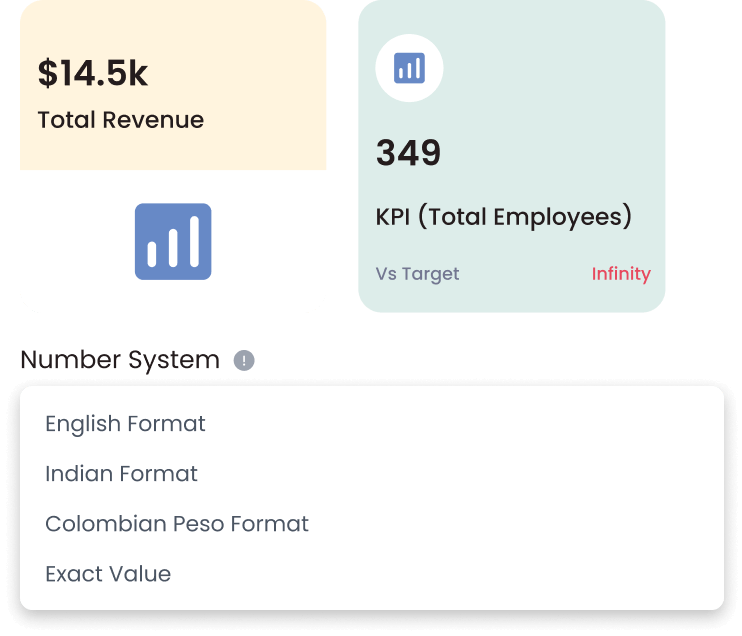
Display key performance indicators (KIPs) in small square-shaped visualizations for a quick glance
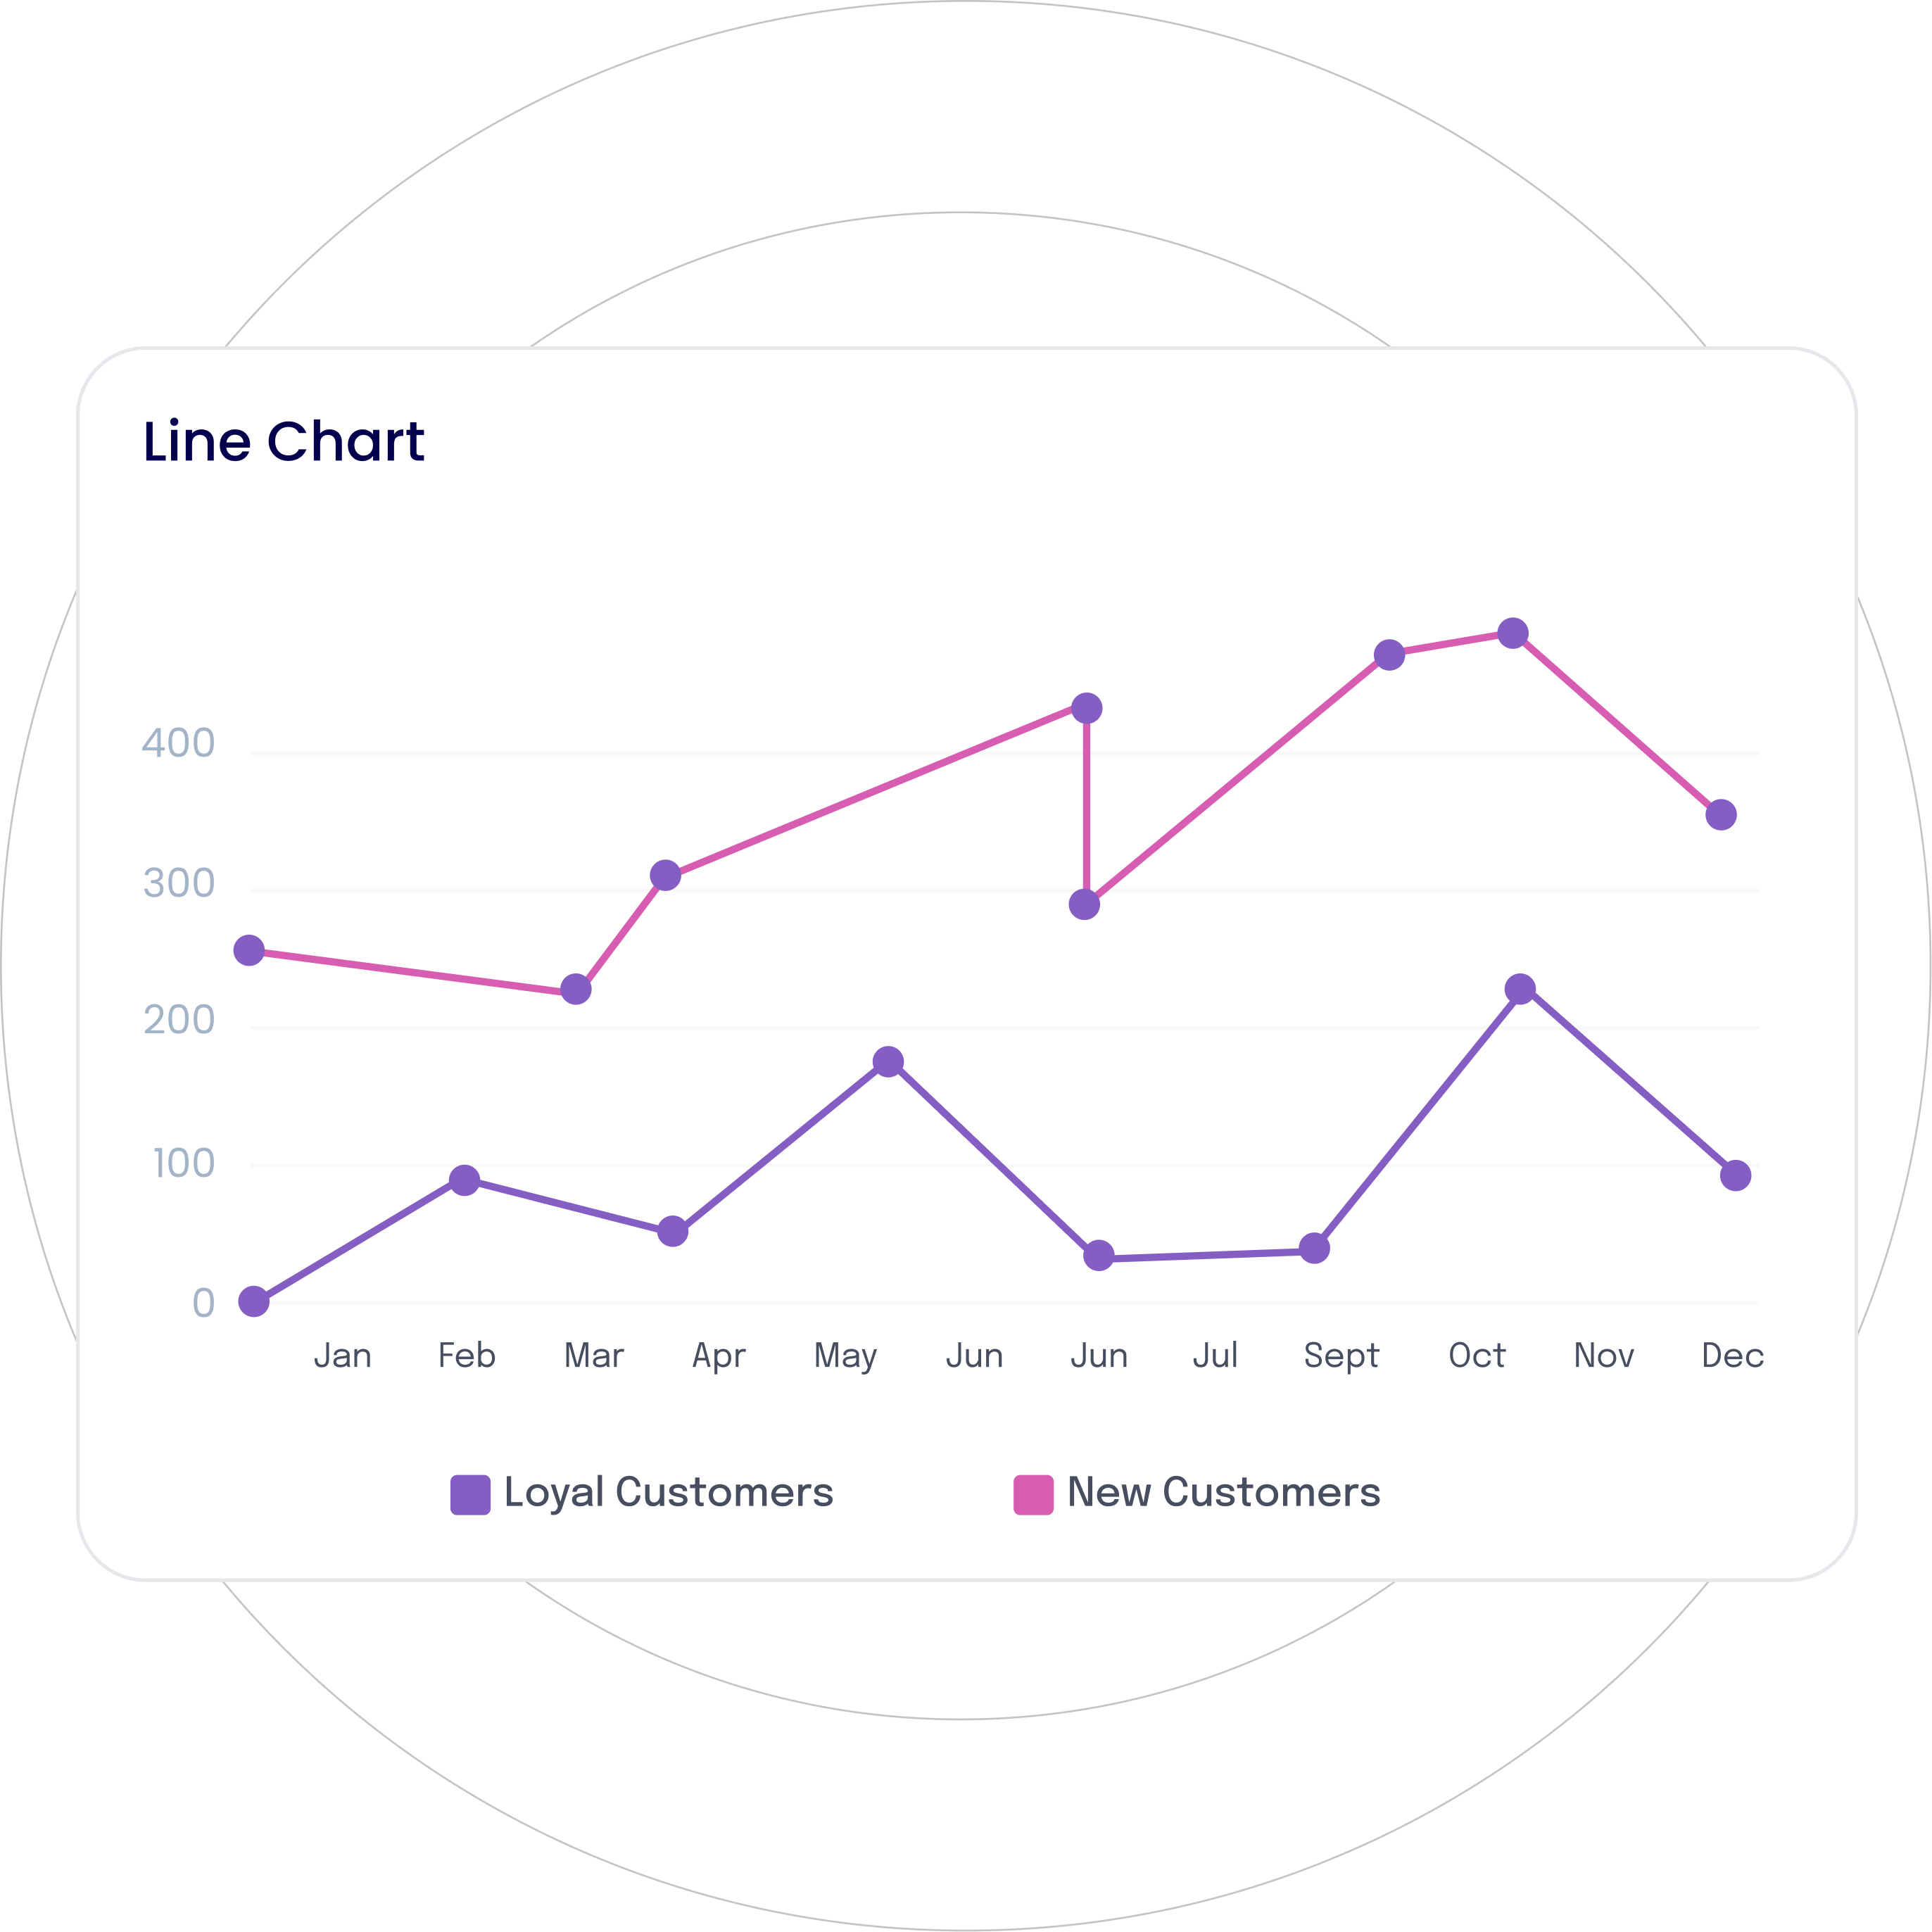
Visualize data trends, changes, or relationships over time by connecting data points with straight lines.
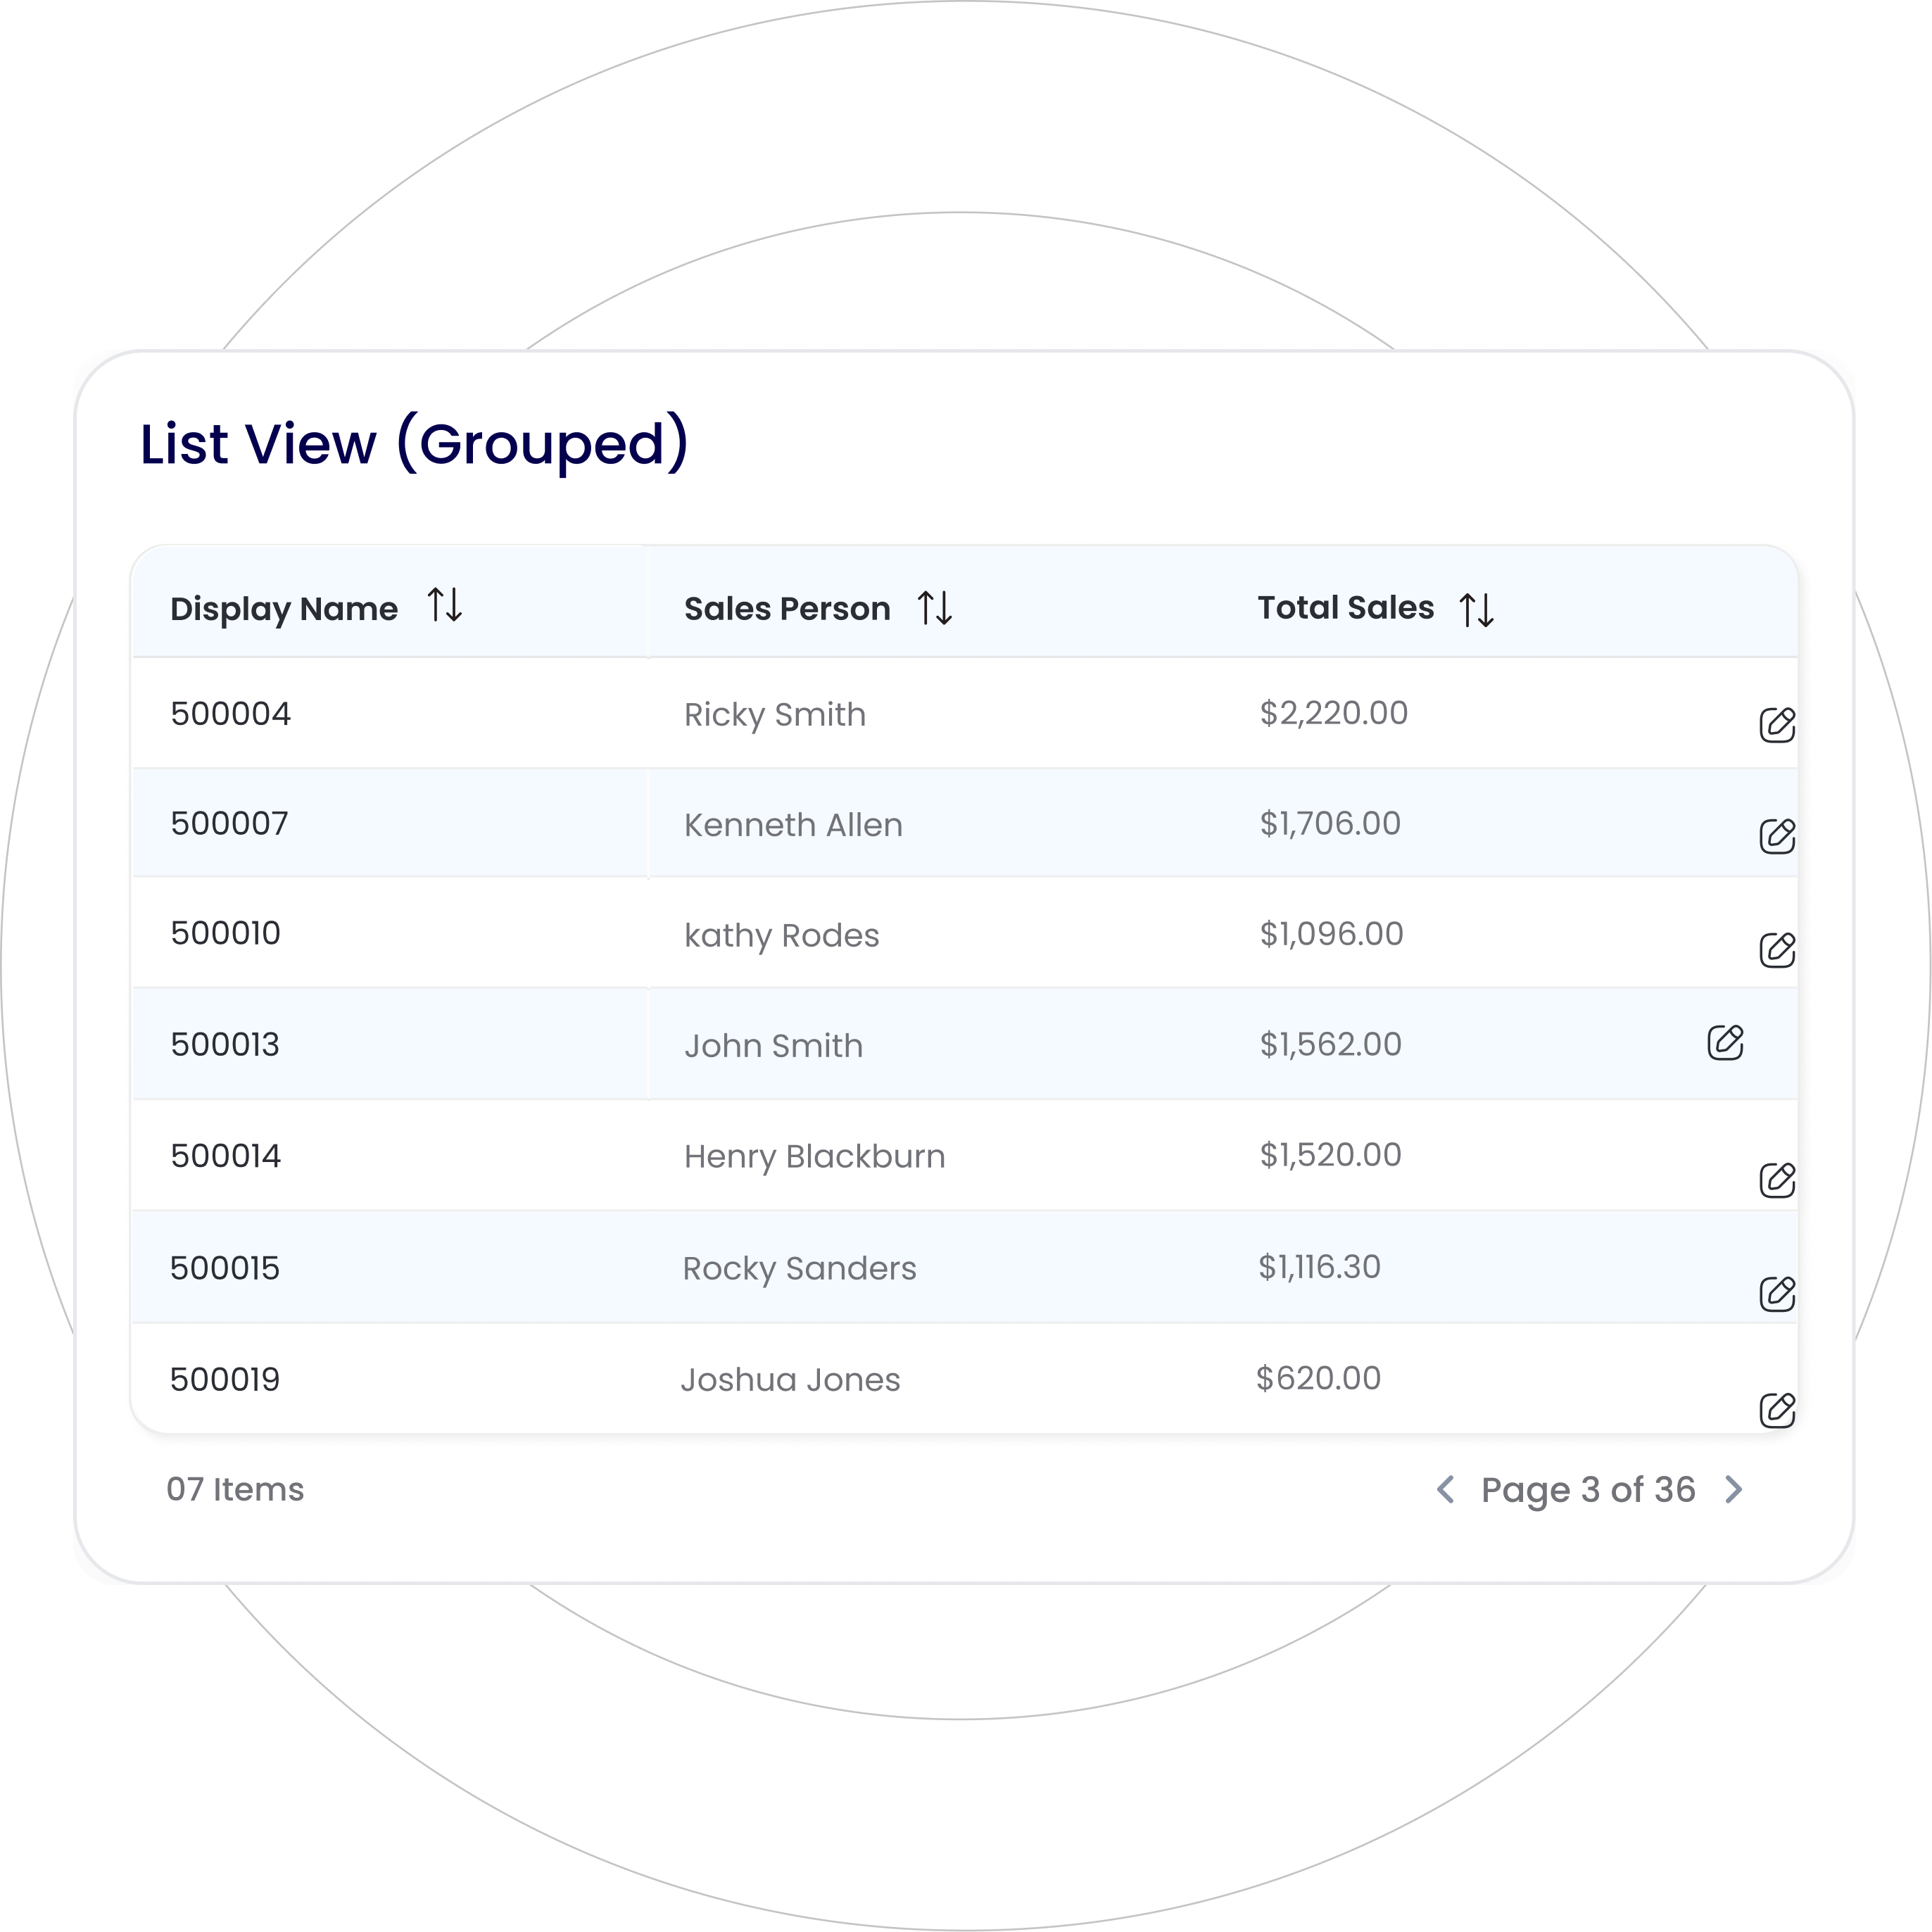
Present detailed data in a tabular format with rows and columns for easy sorting and comparison.
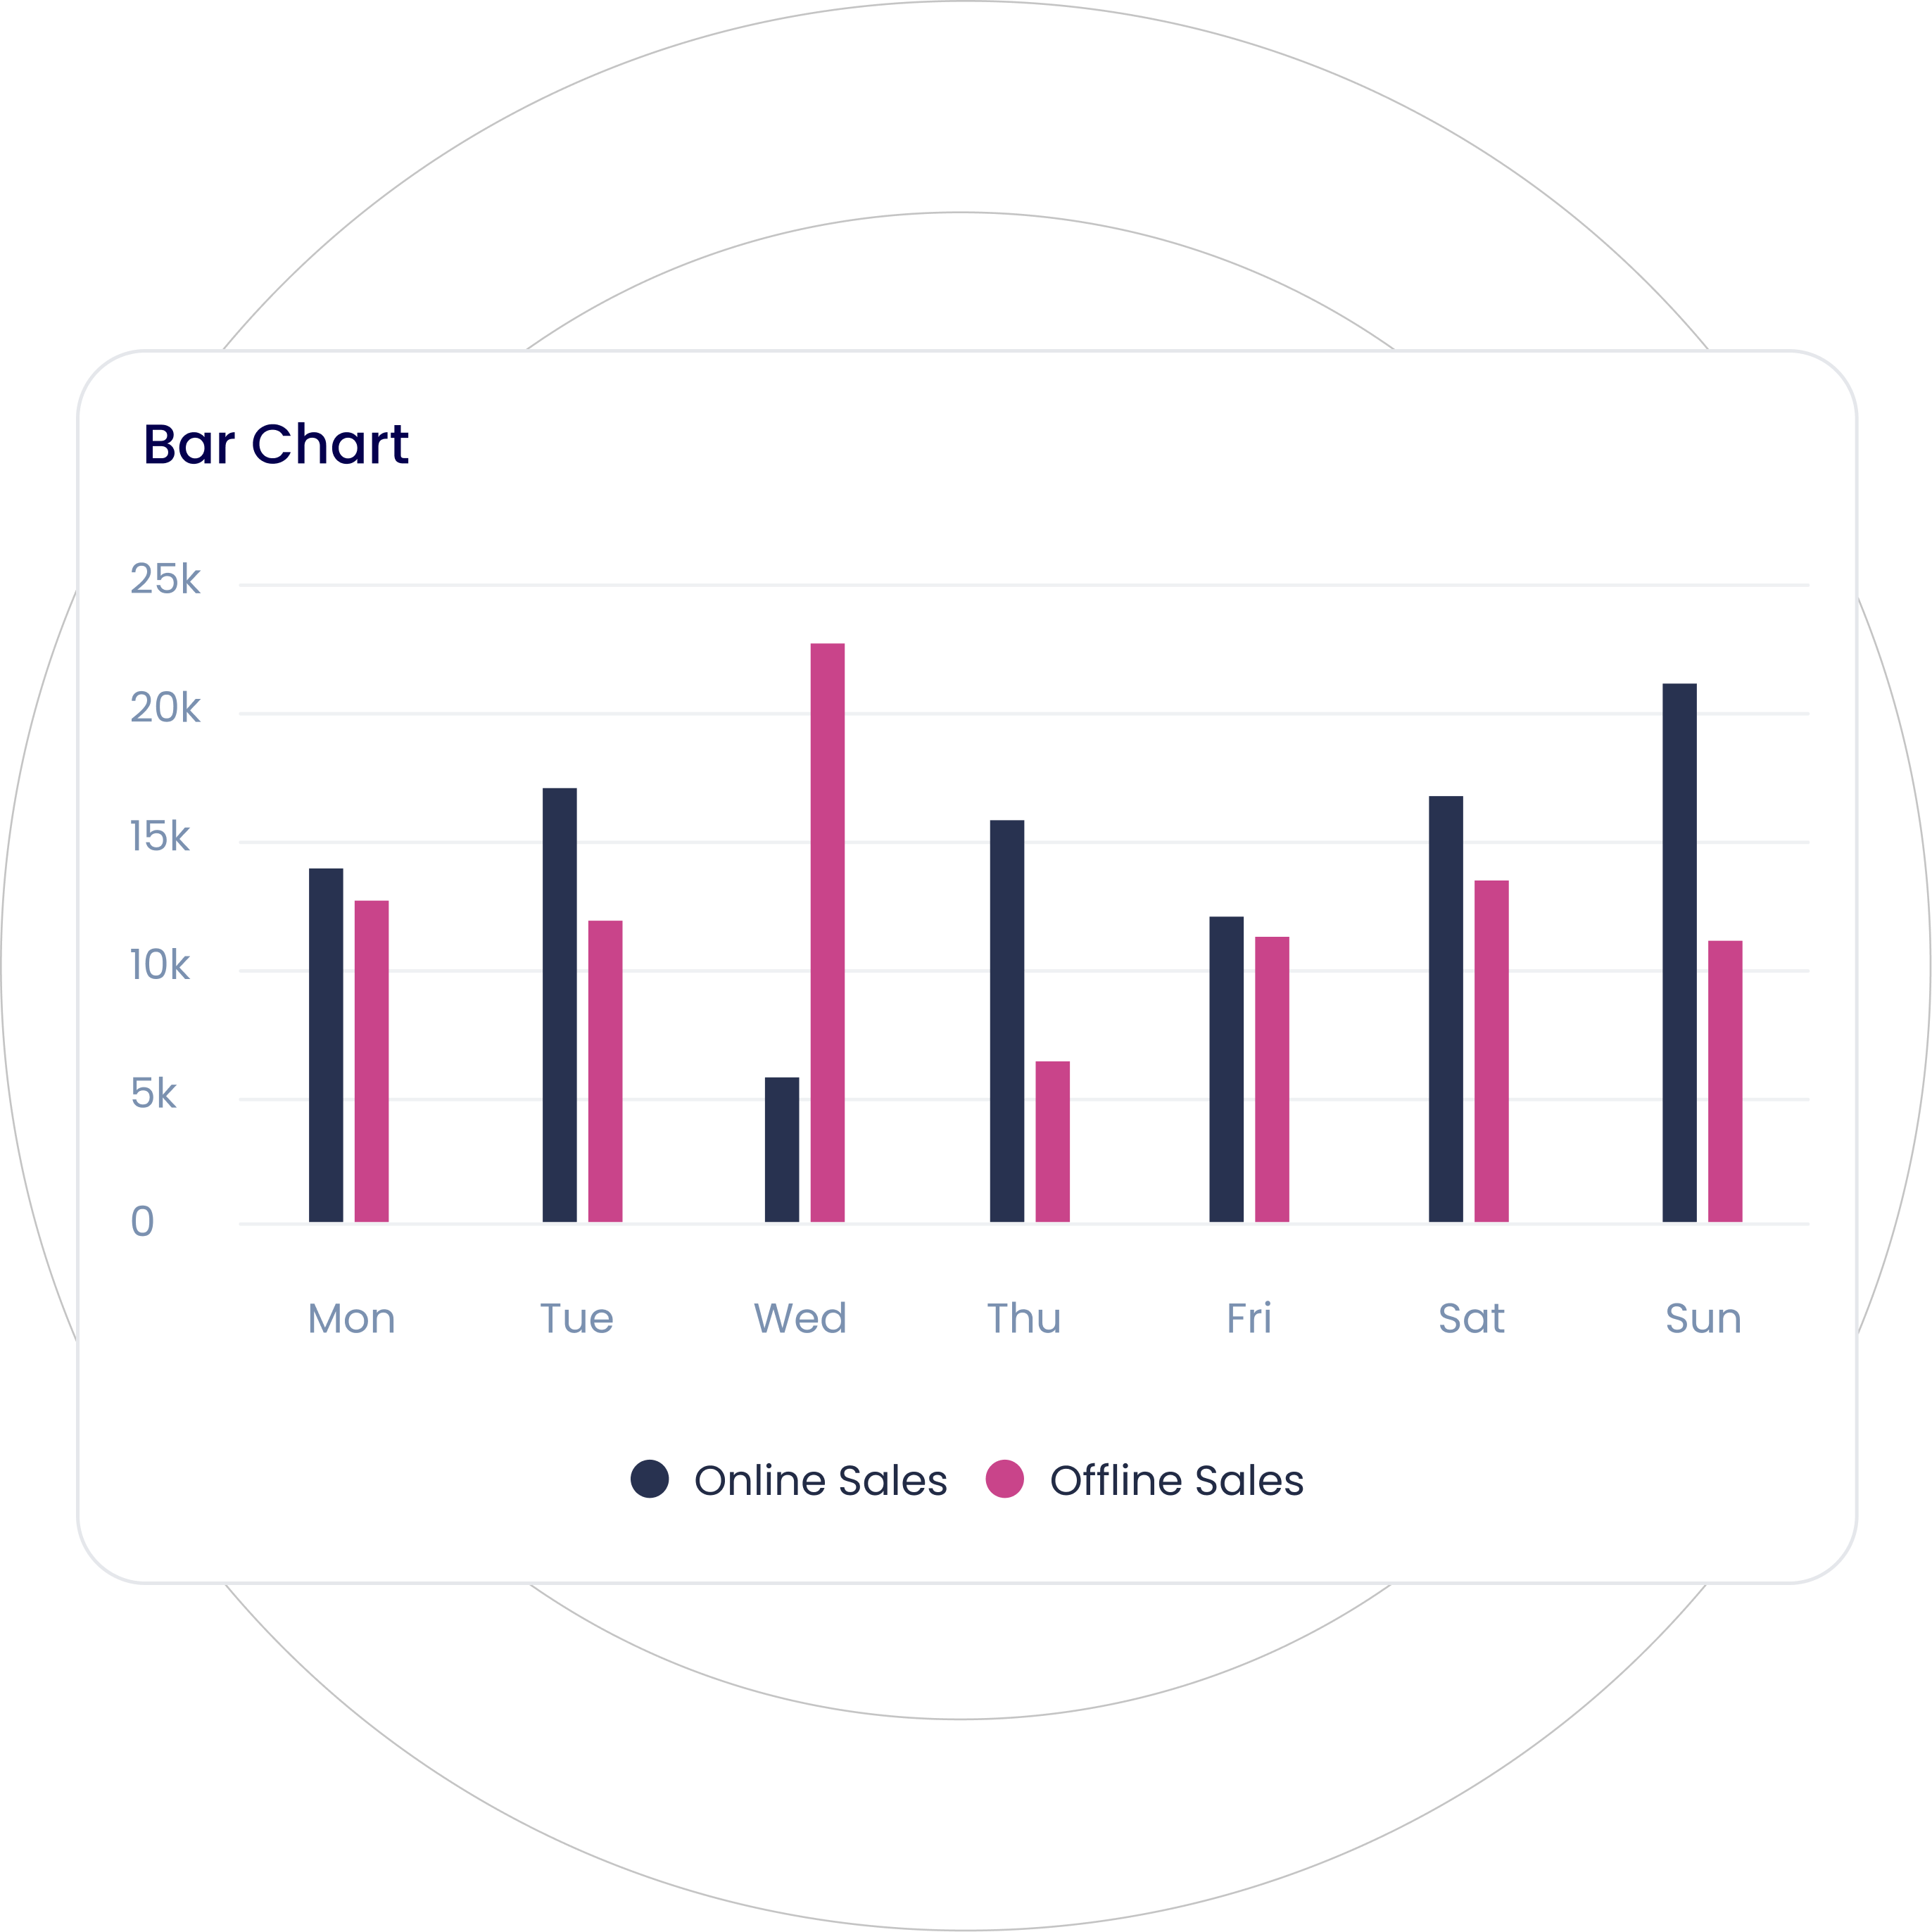
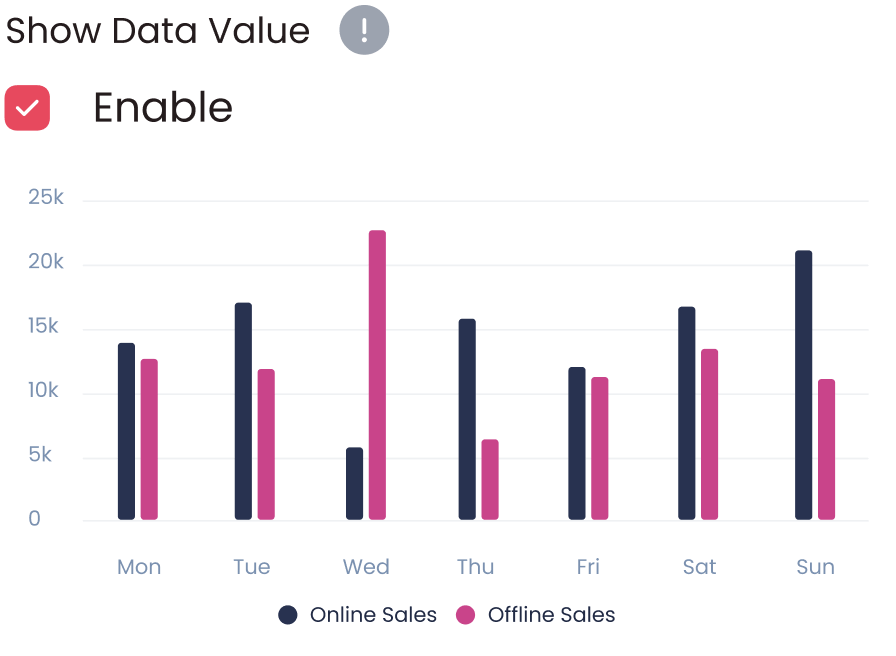
Visualize categorical data with rectangular vertical bars with the height proportionate to the value they represent.
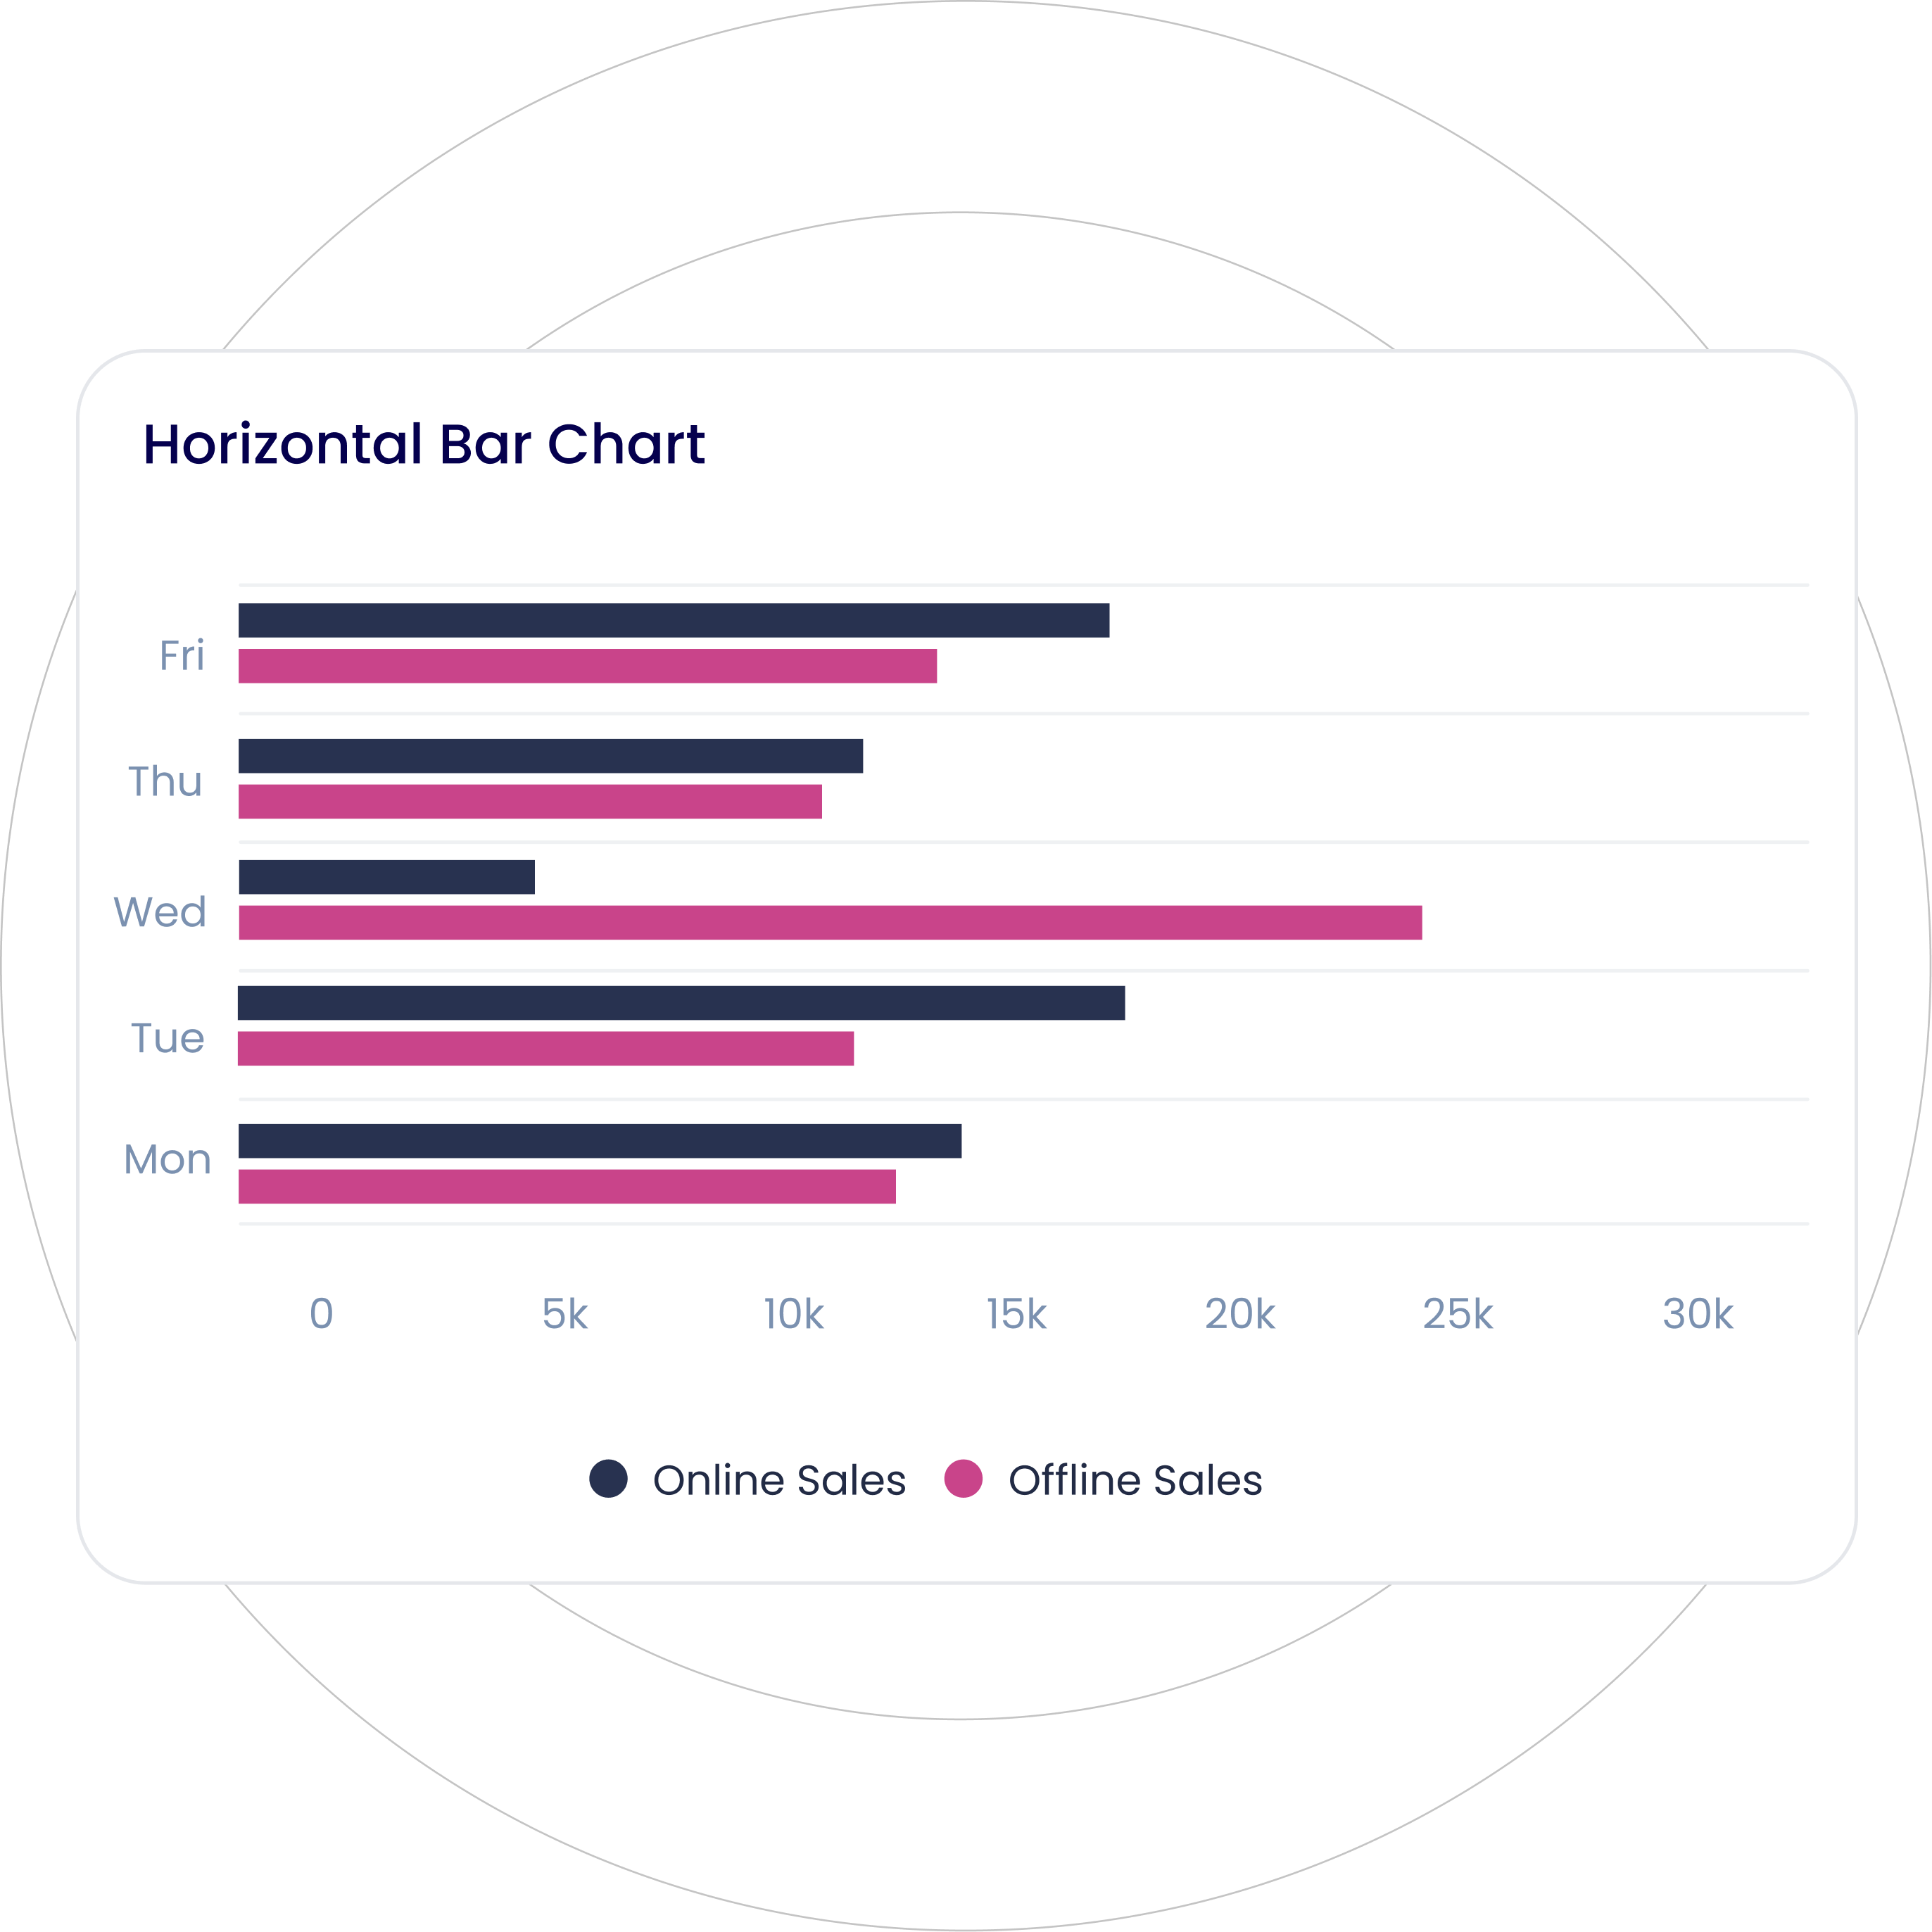
Represent categorical data with rectangular horizontal bars, representing the difference between data categories.
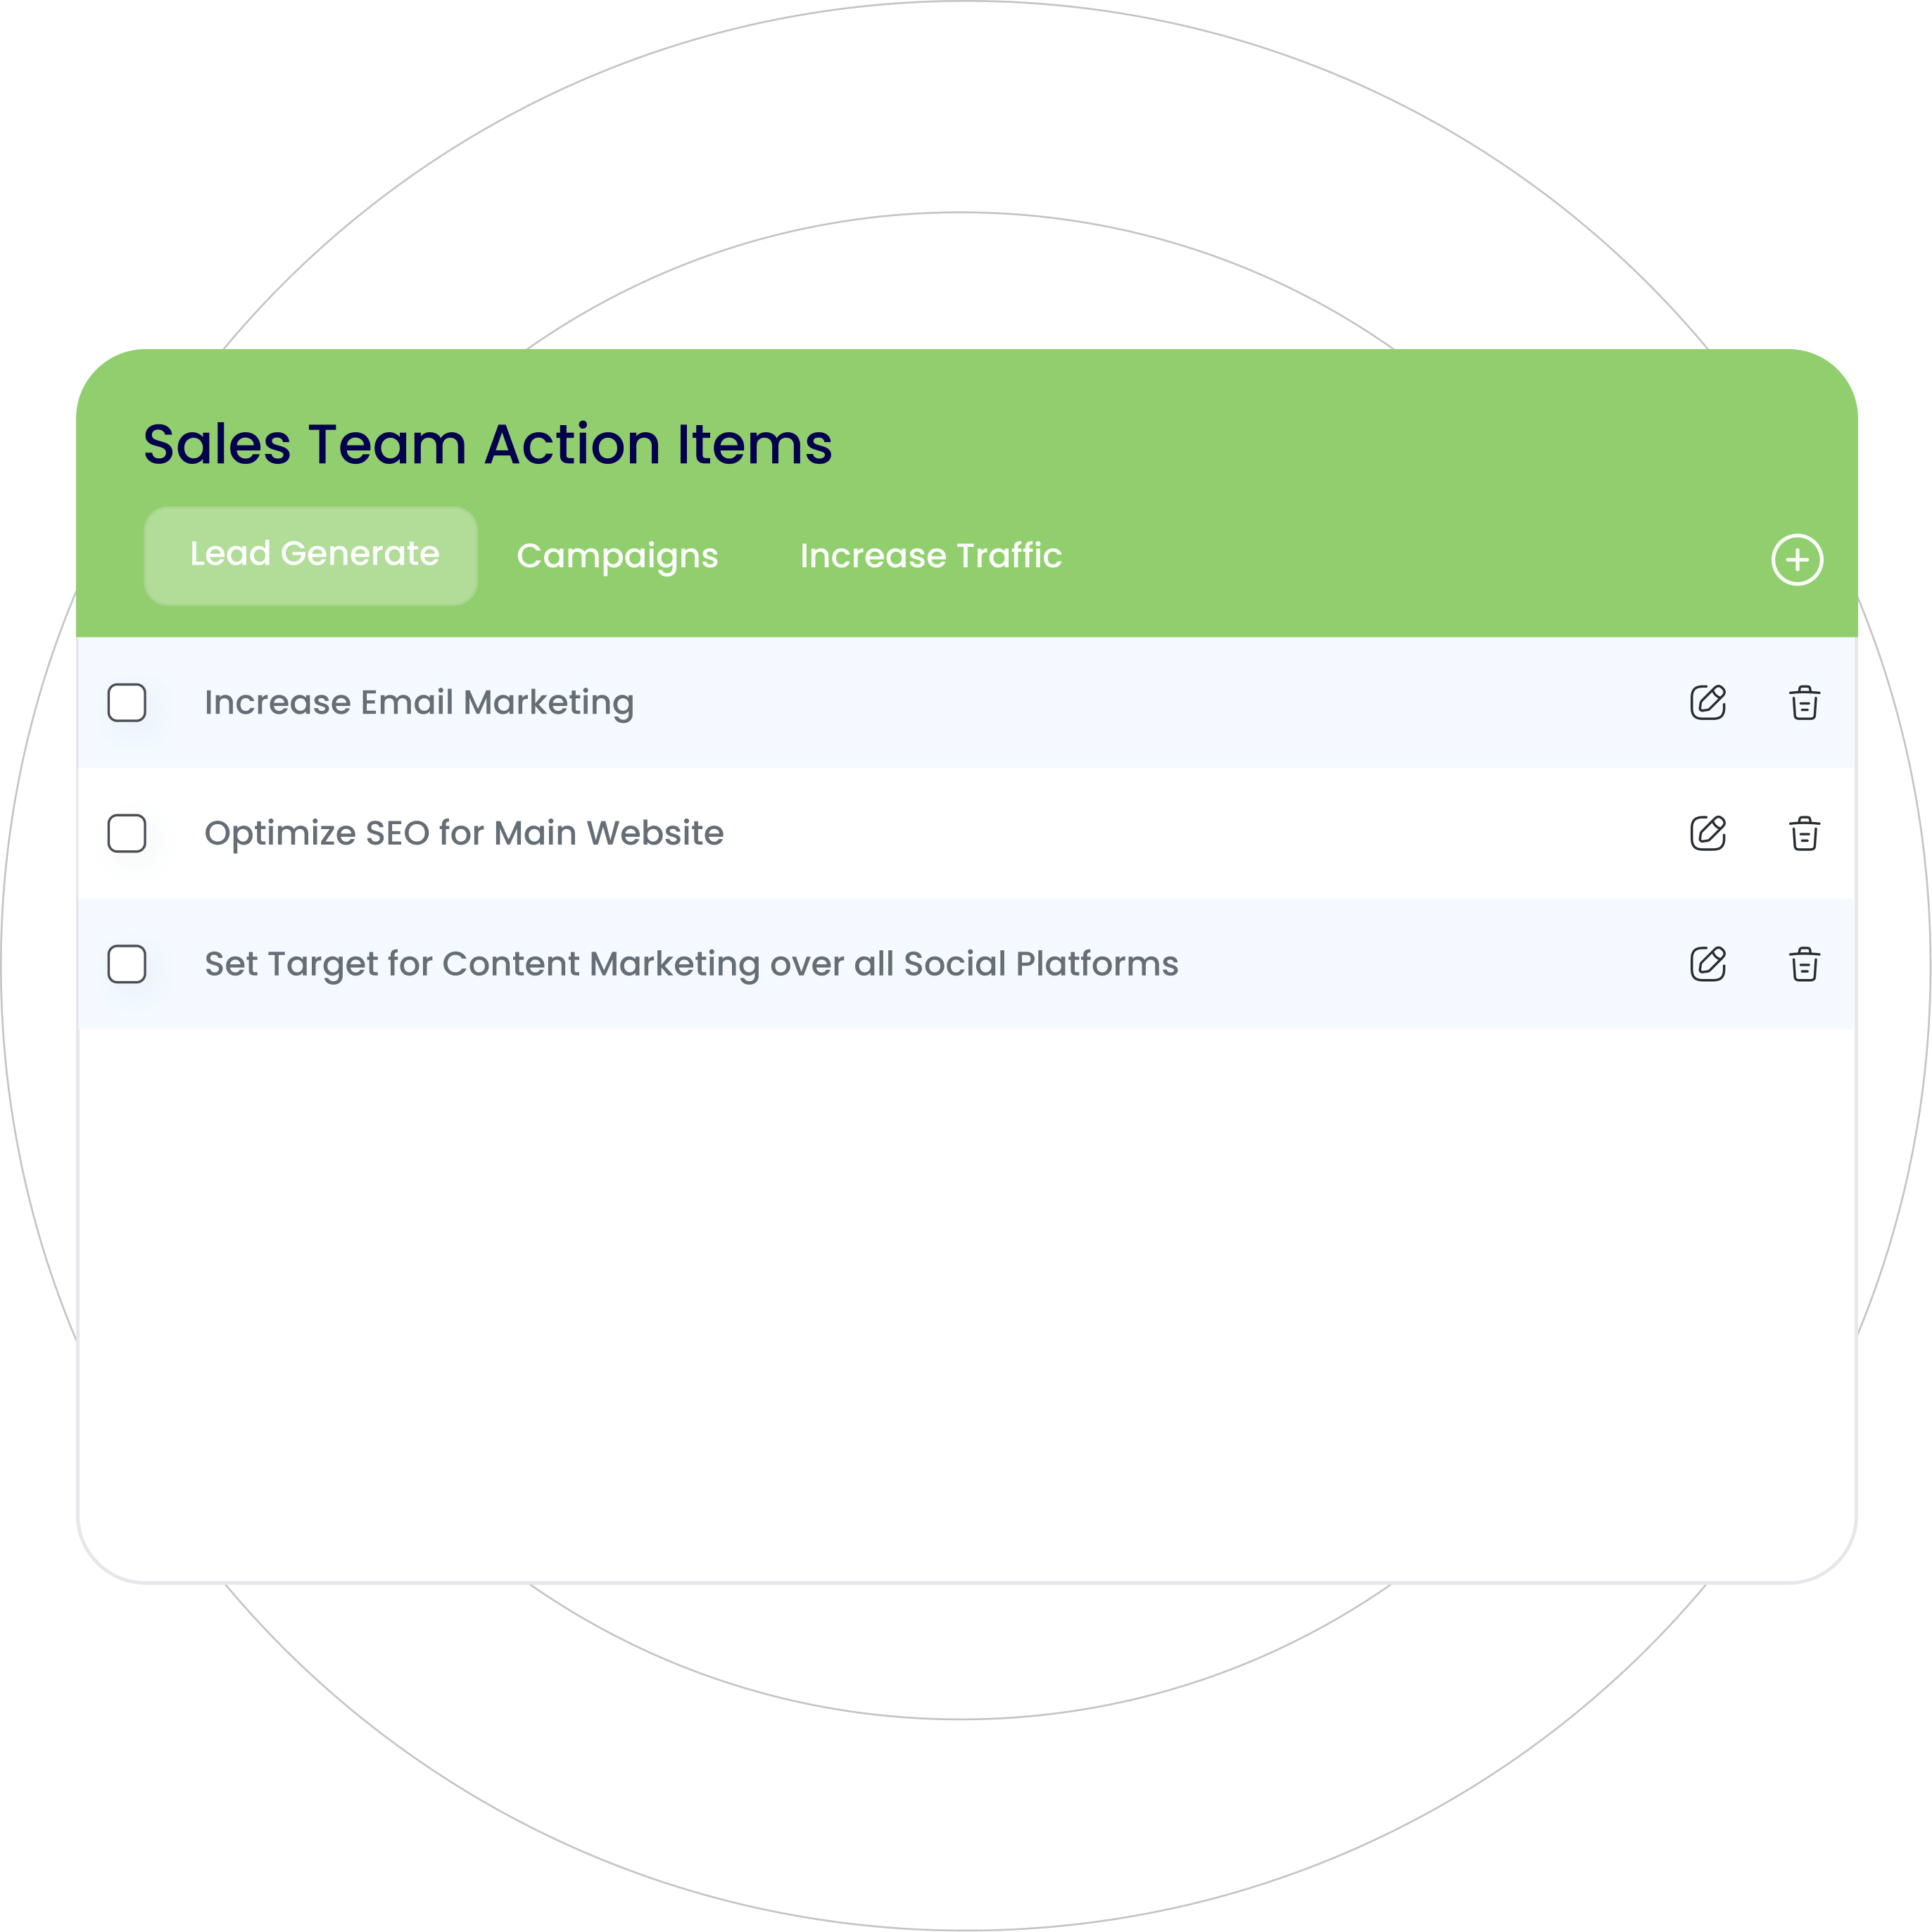
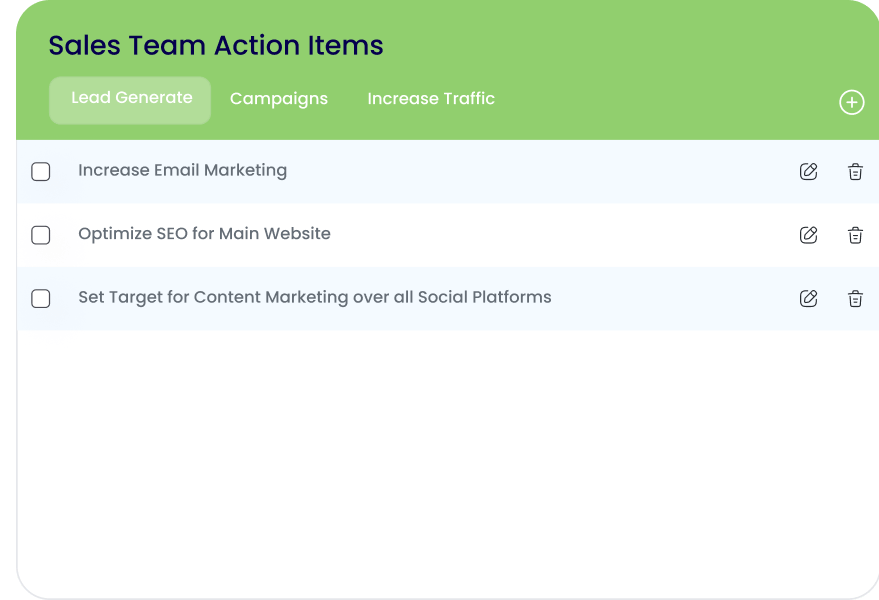
Organize all tasks or actions that need to be completed in the form of a checklist, ensuring easy tracking of progress.
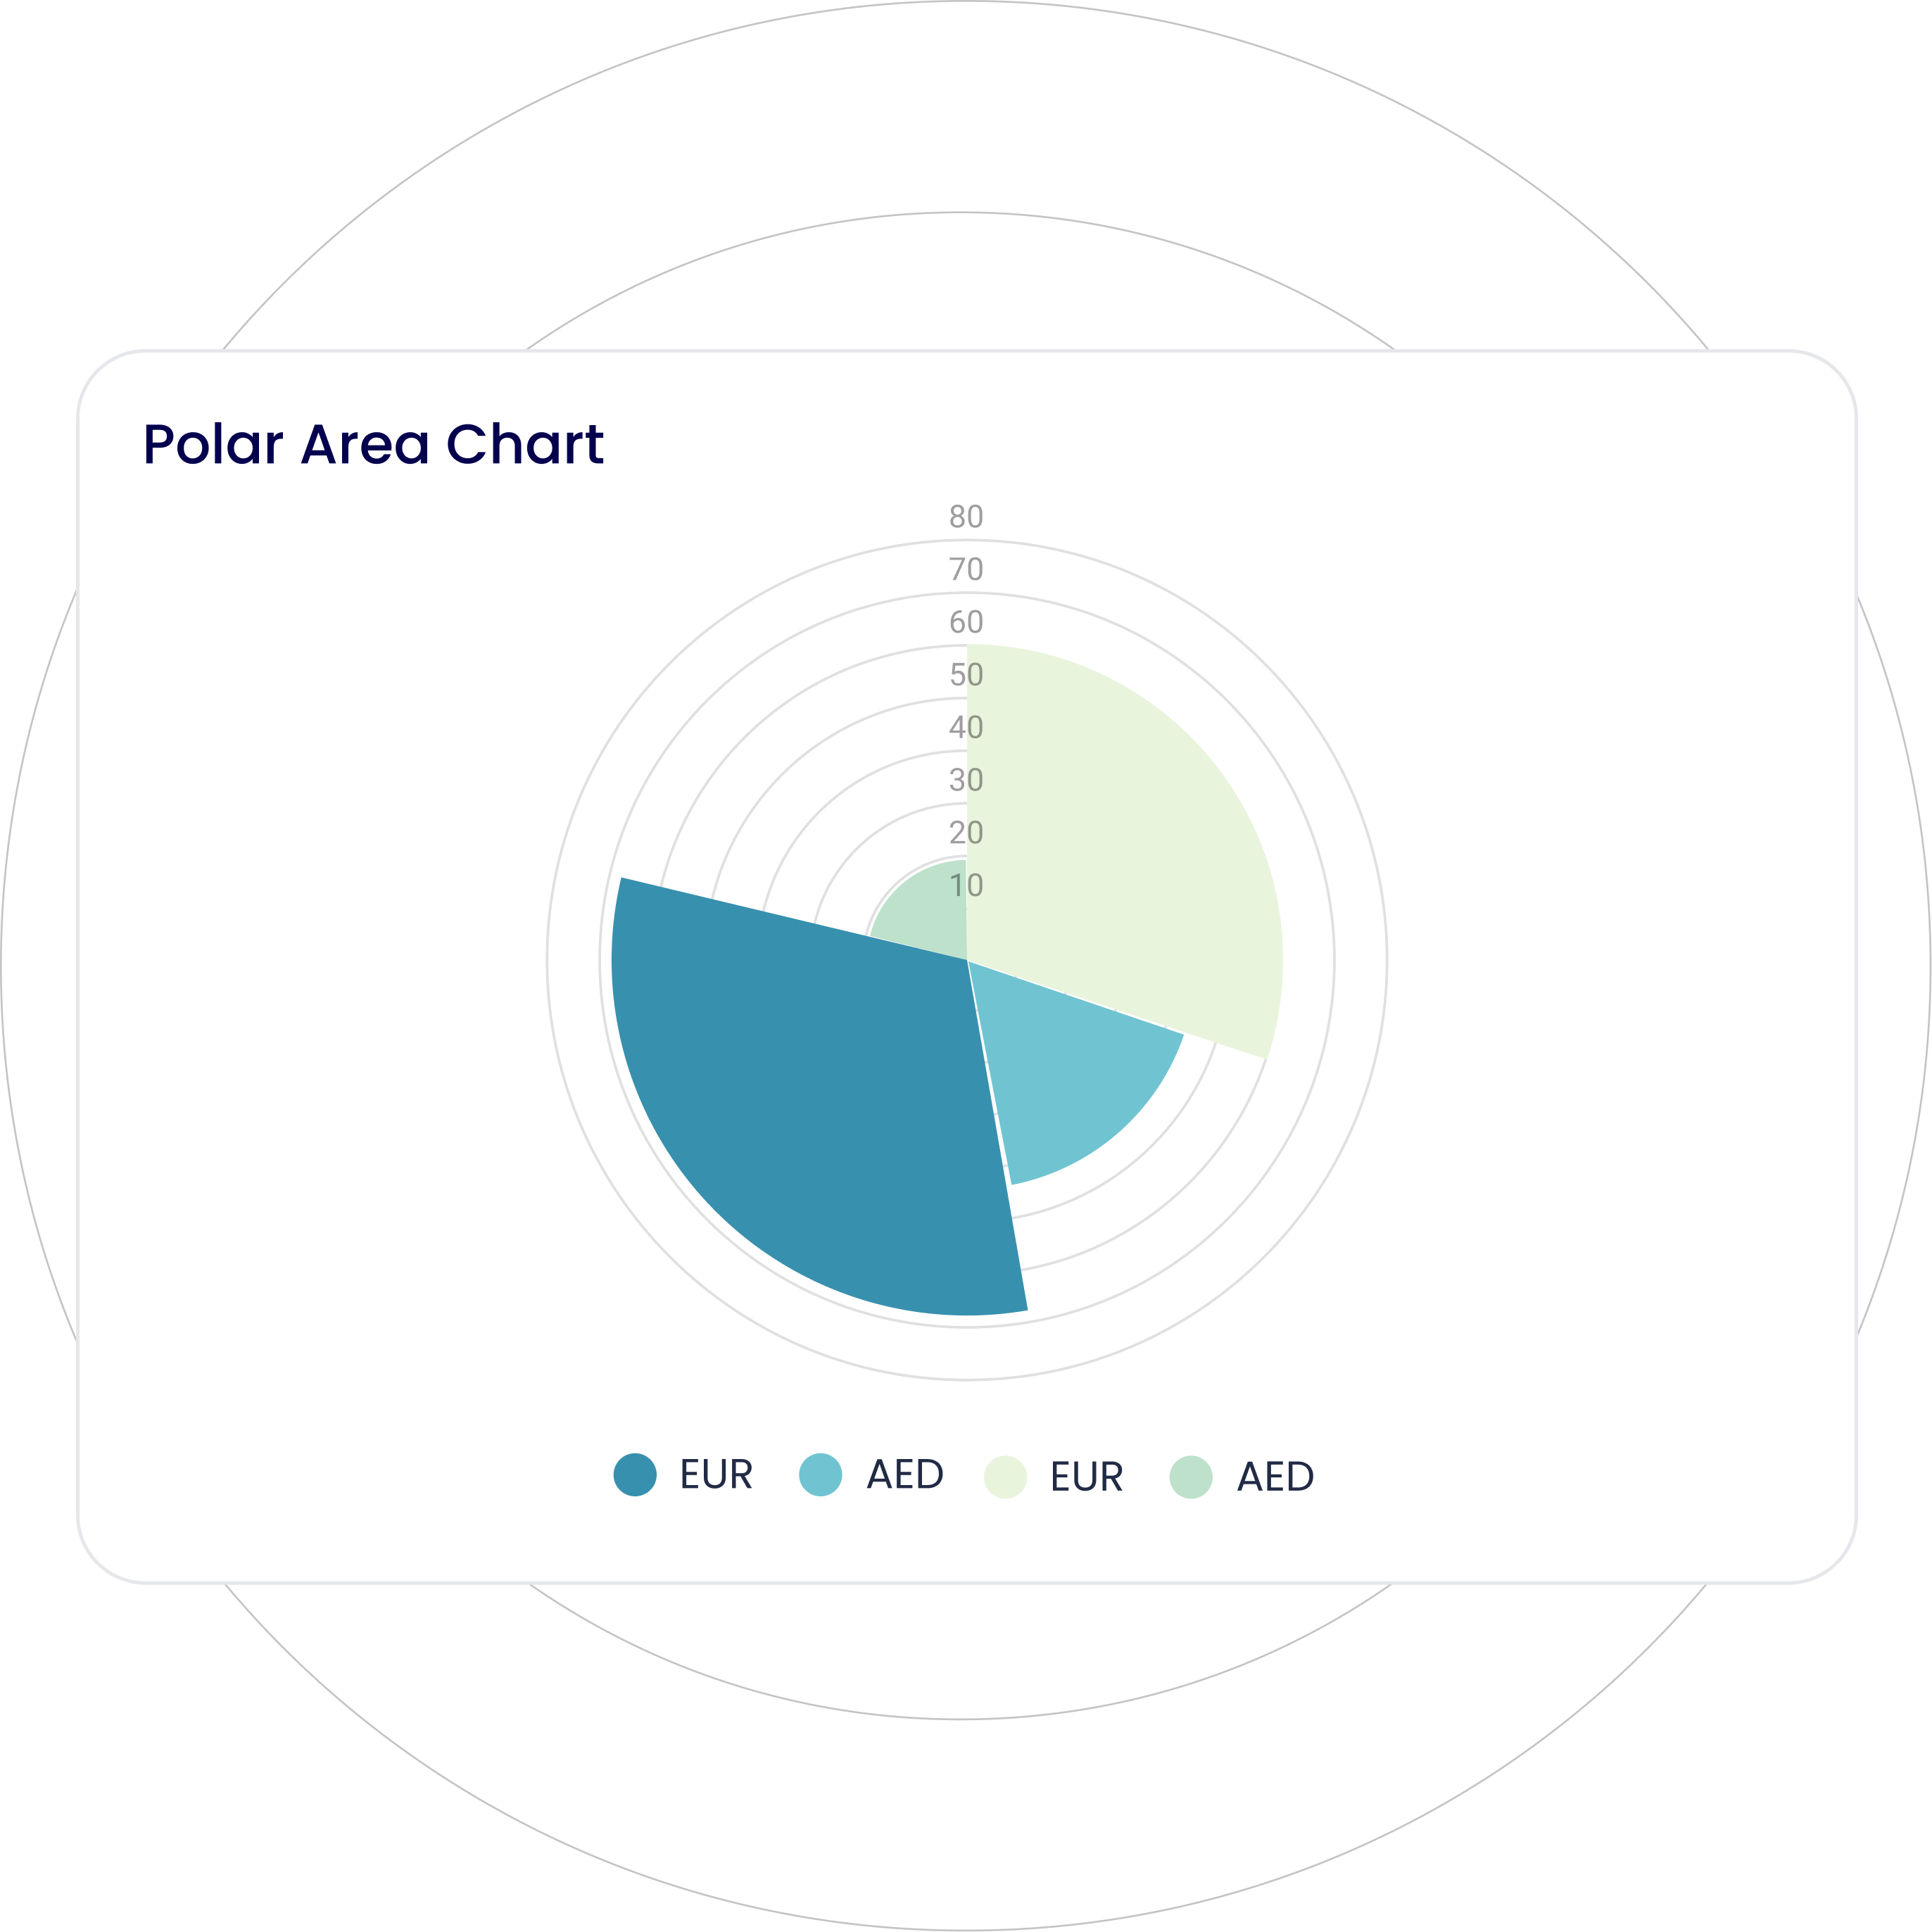
Represent cyclical data using radial lines separating segments, with each segment’s area representing its value.
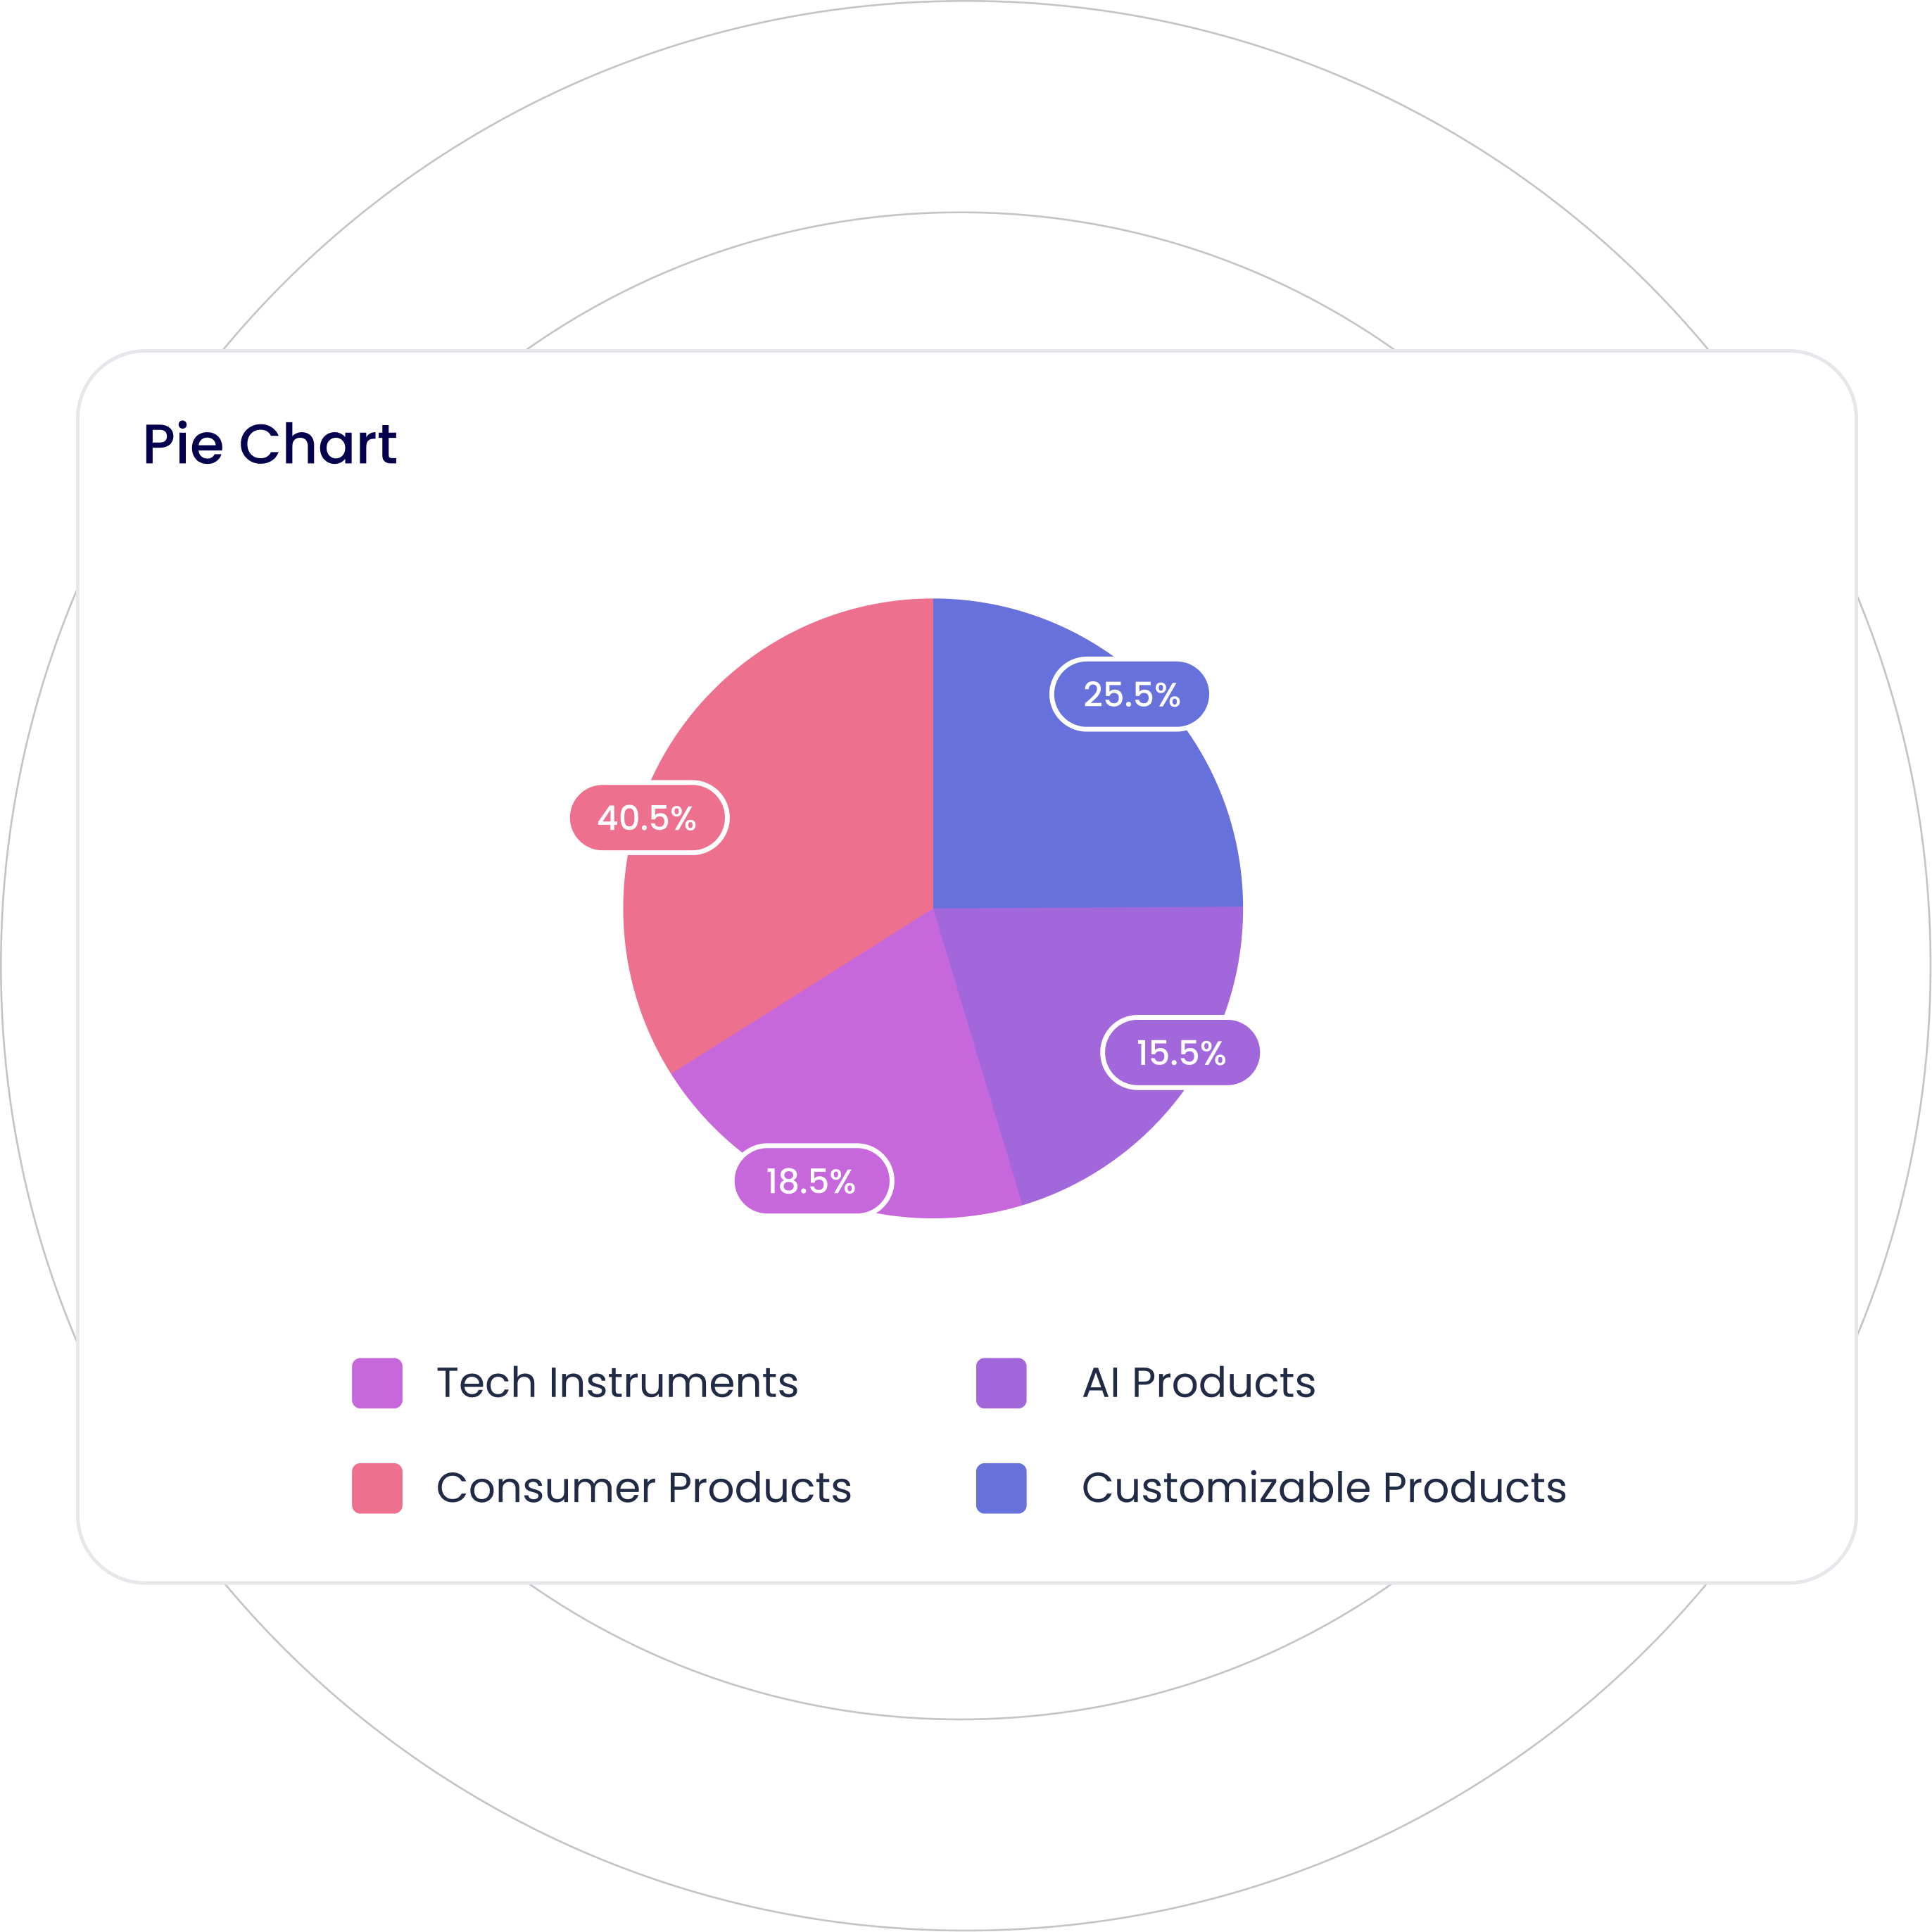
Display your data in a circular graph, with each slice of a circle representing a fraction or proportionate part of the whole.
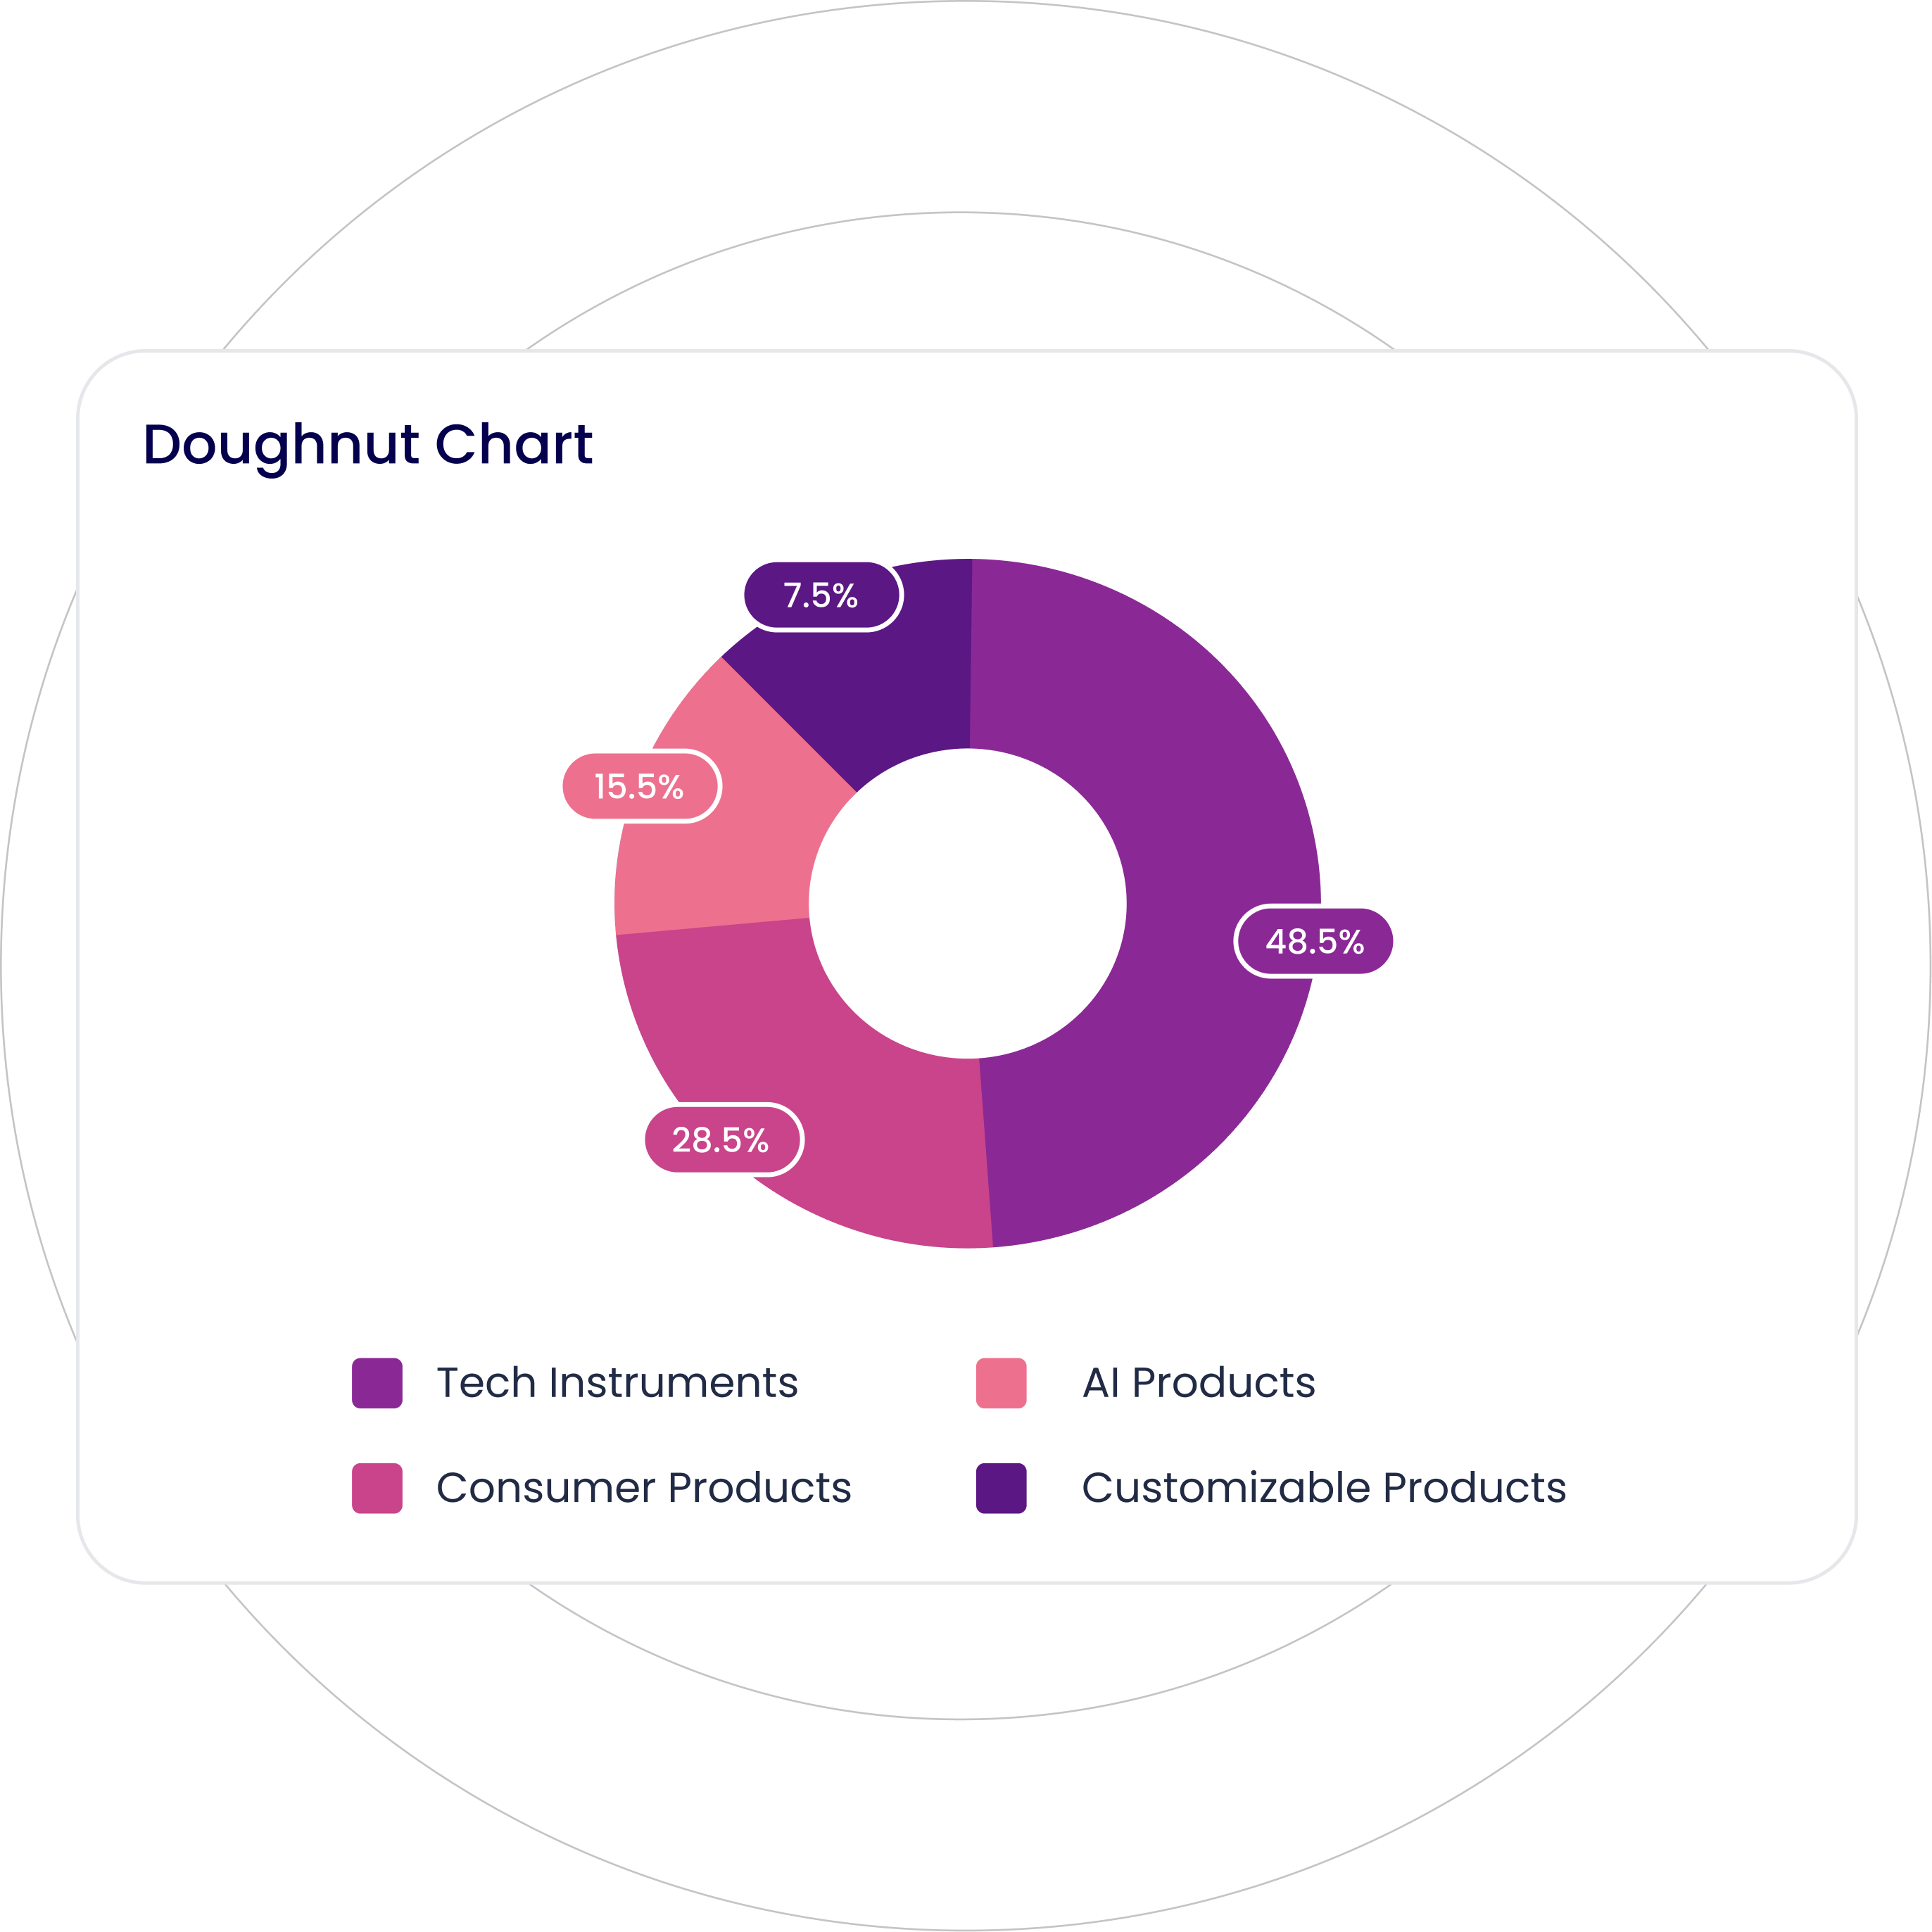
Similar to a pie chart with a central hole, providing a clean and modern look.

Visualize multivariate data wherein data points are displayed as petals radiating from a central point, with each petal’s size or color representing its value.
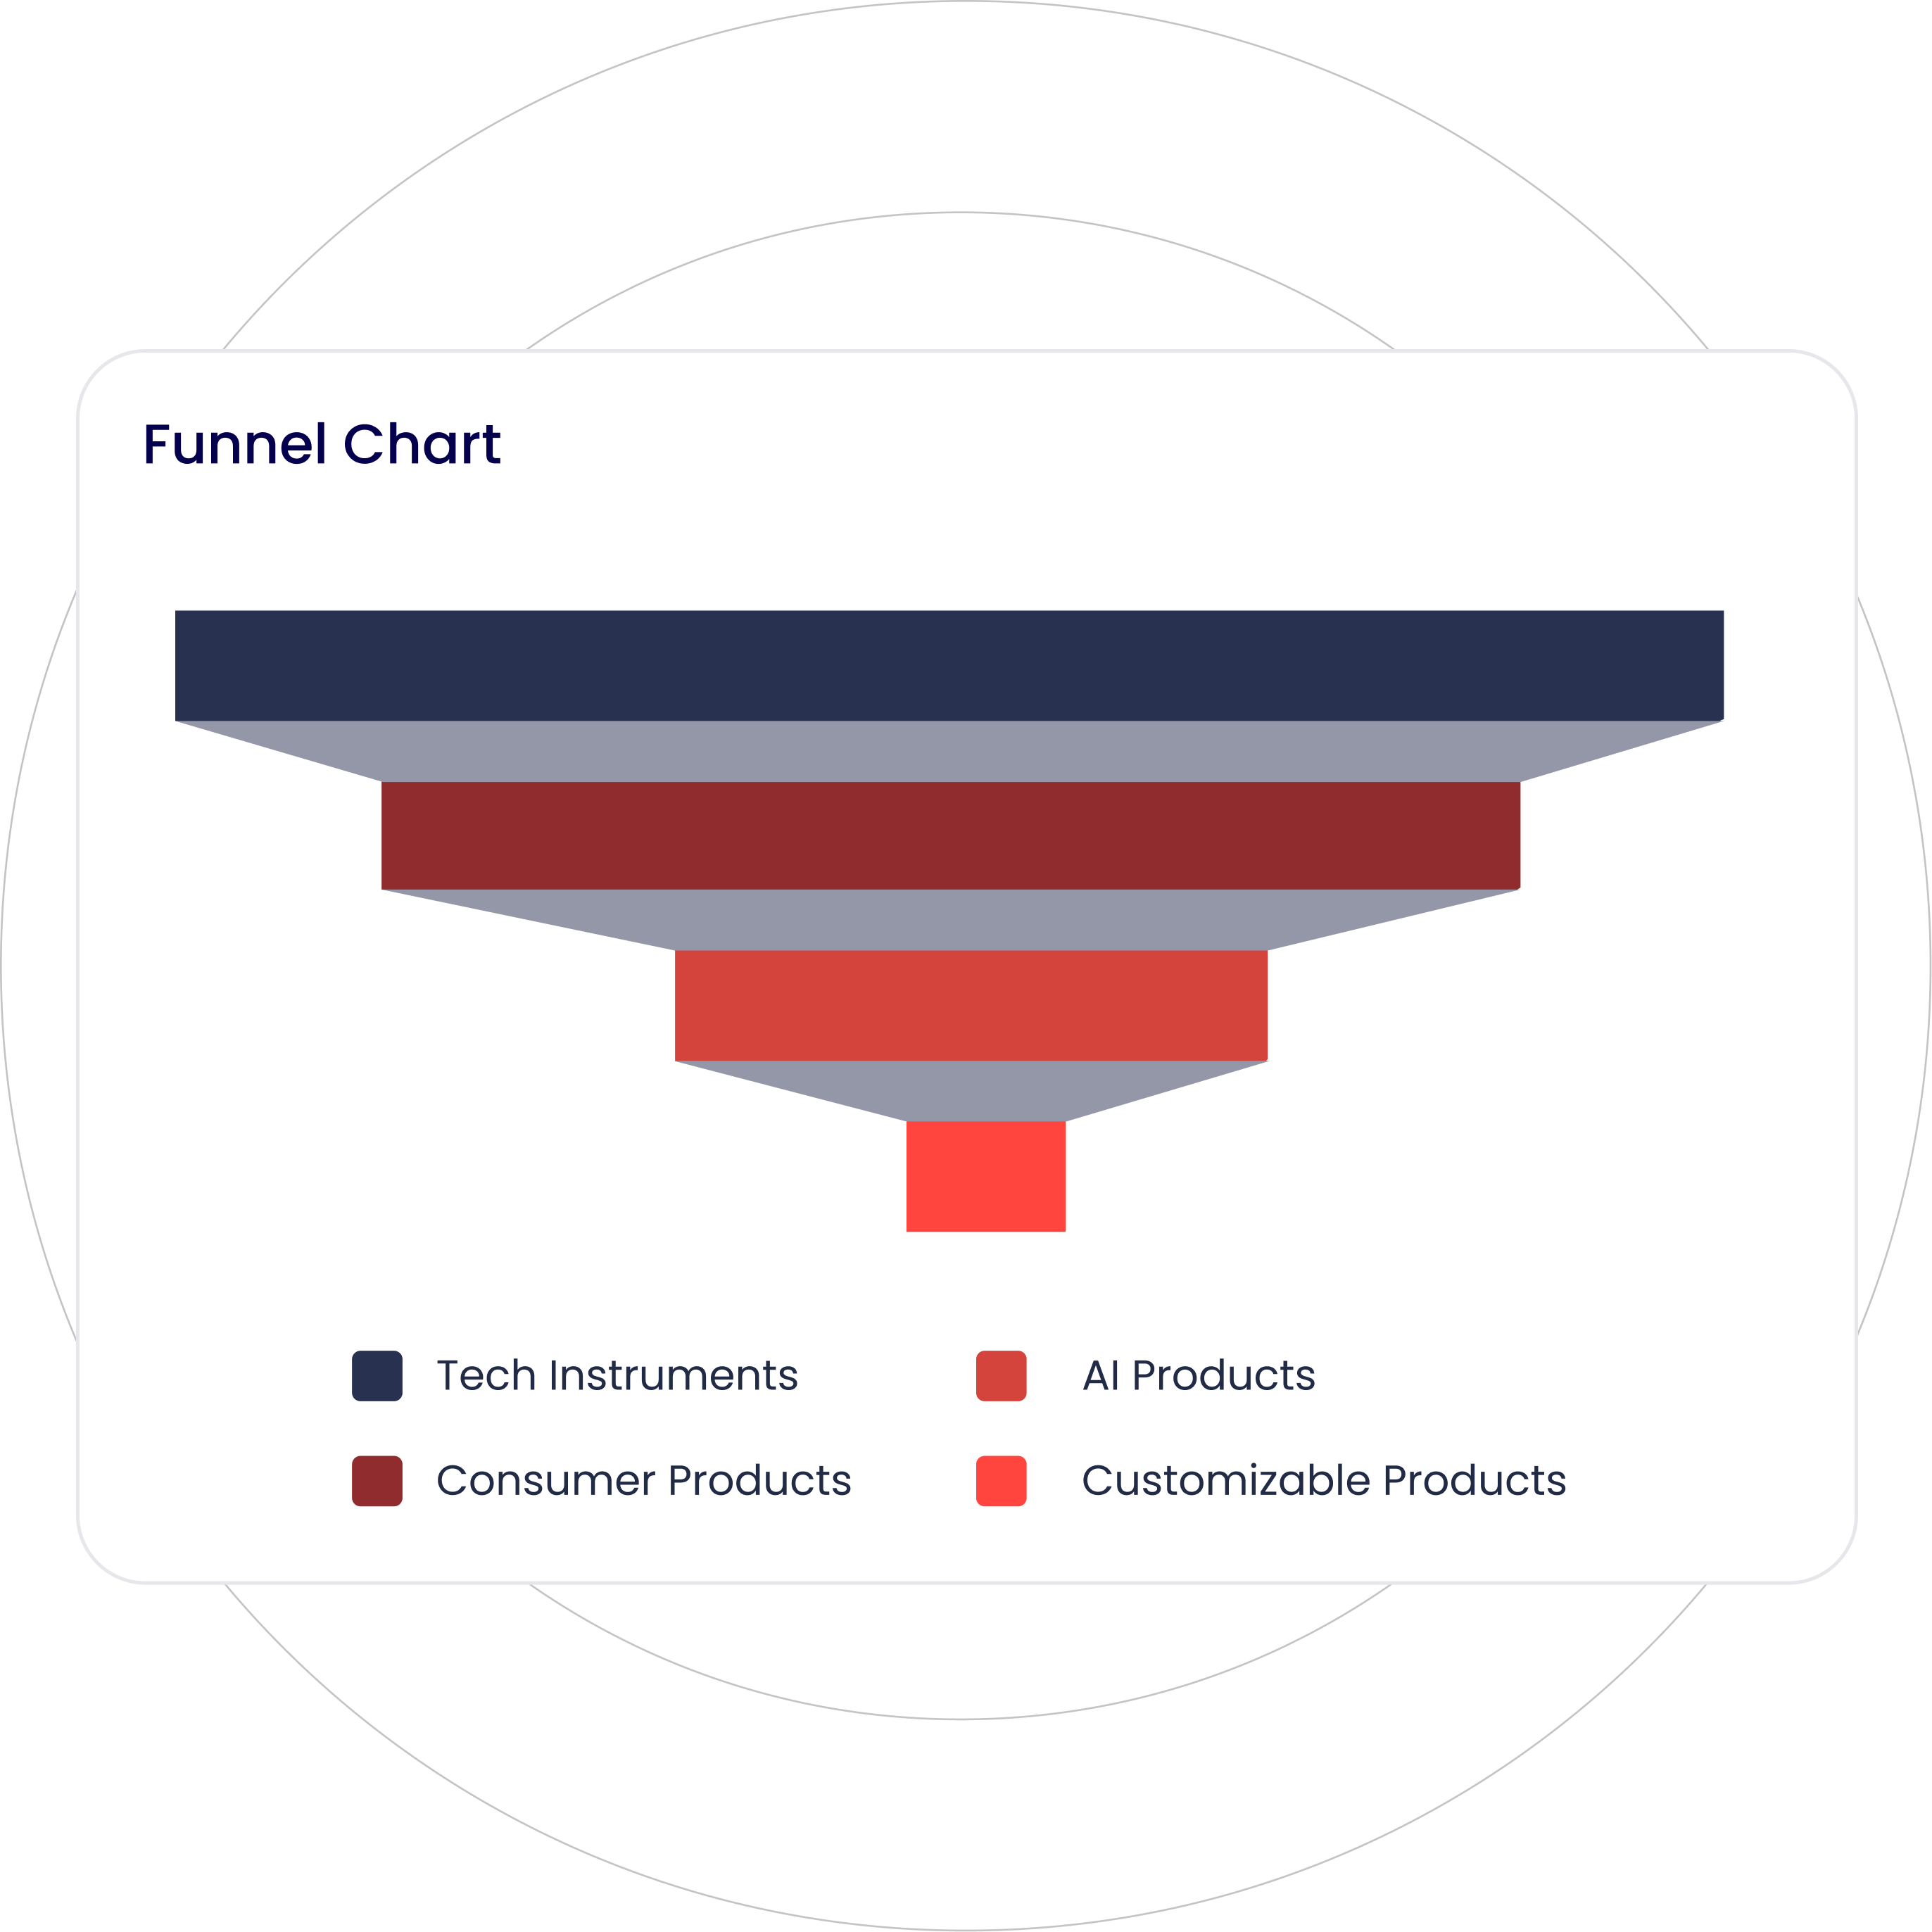
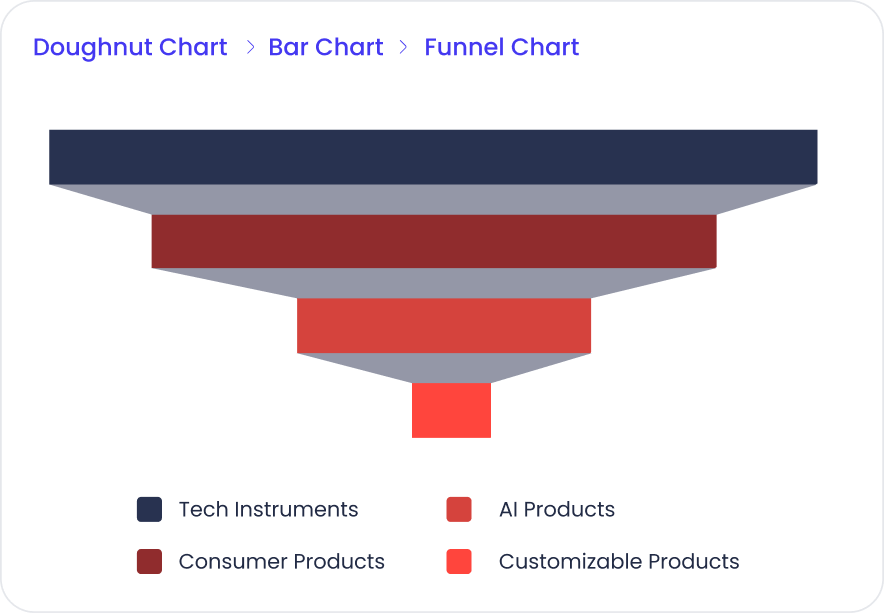
Visualize data as it moves through different stages of a process with decreasing segments. Ideal to visualize conversion rates or sales pipelines.
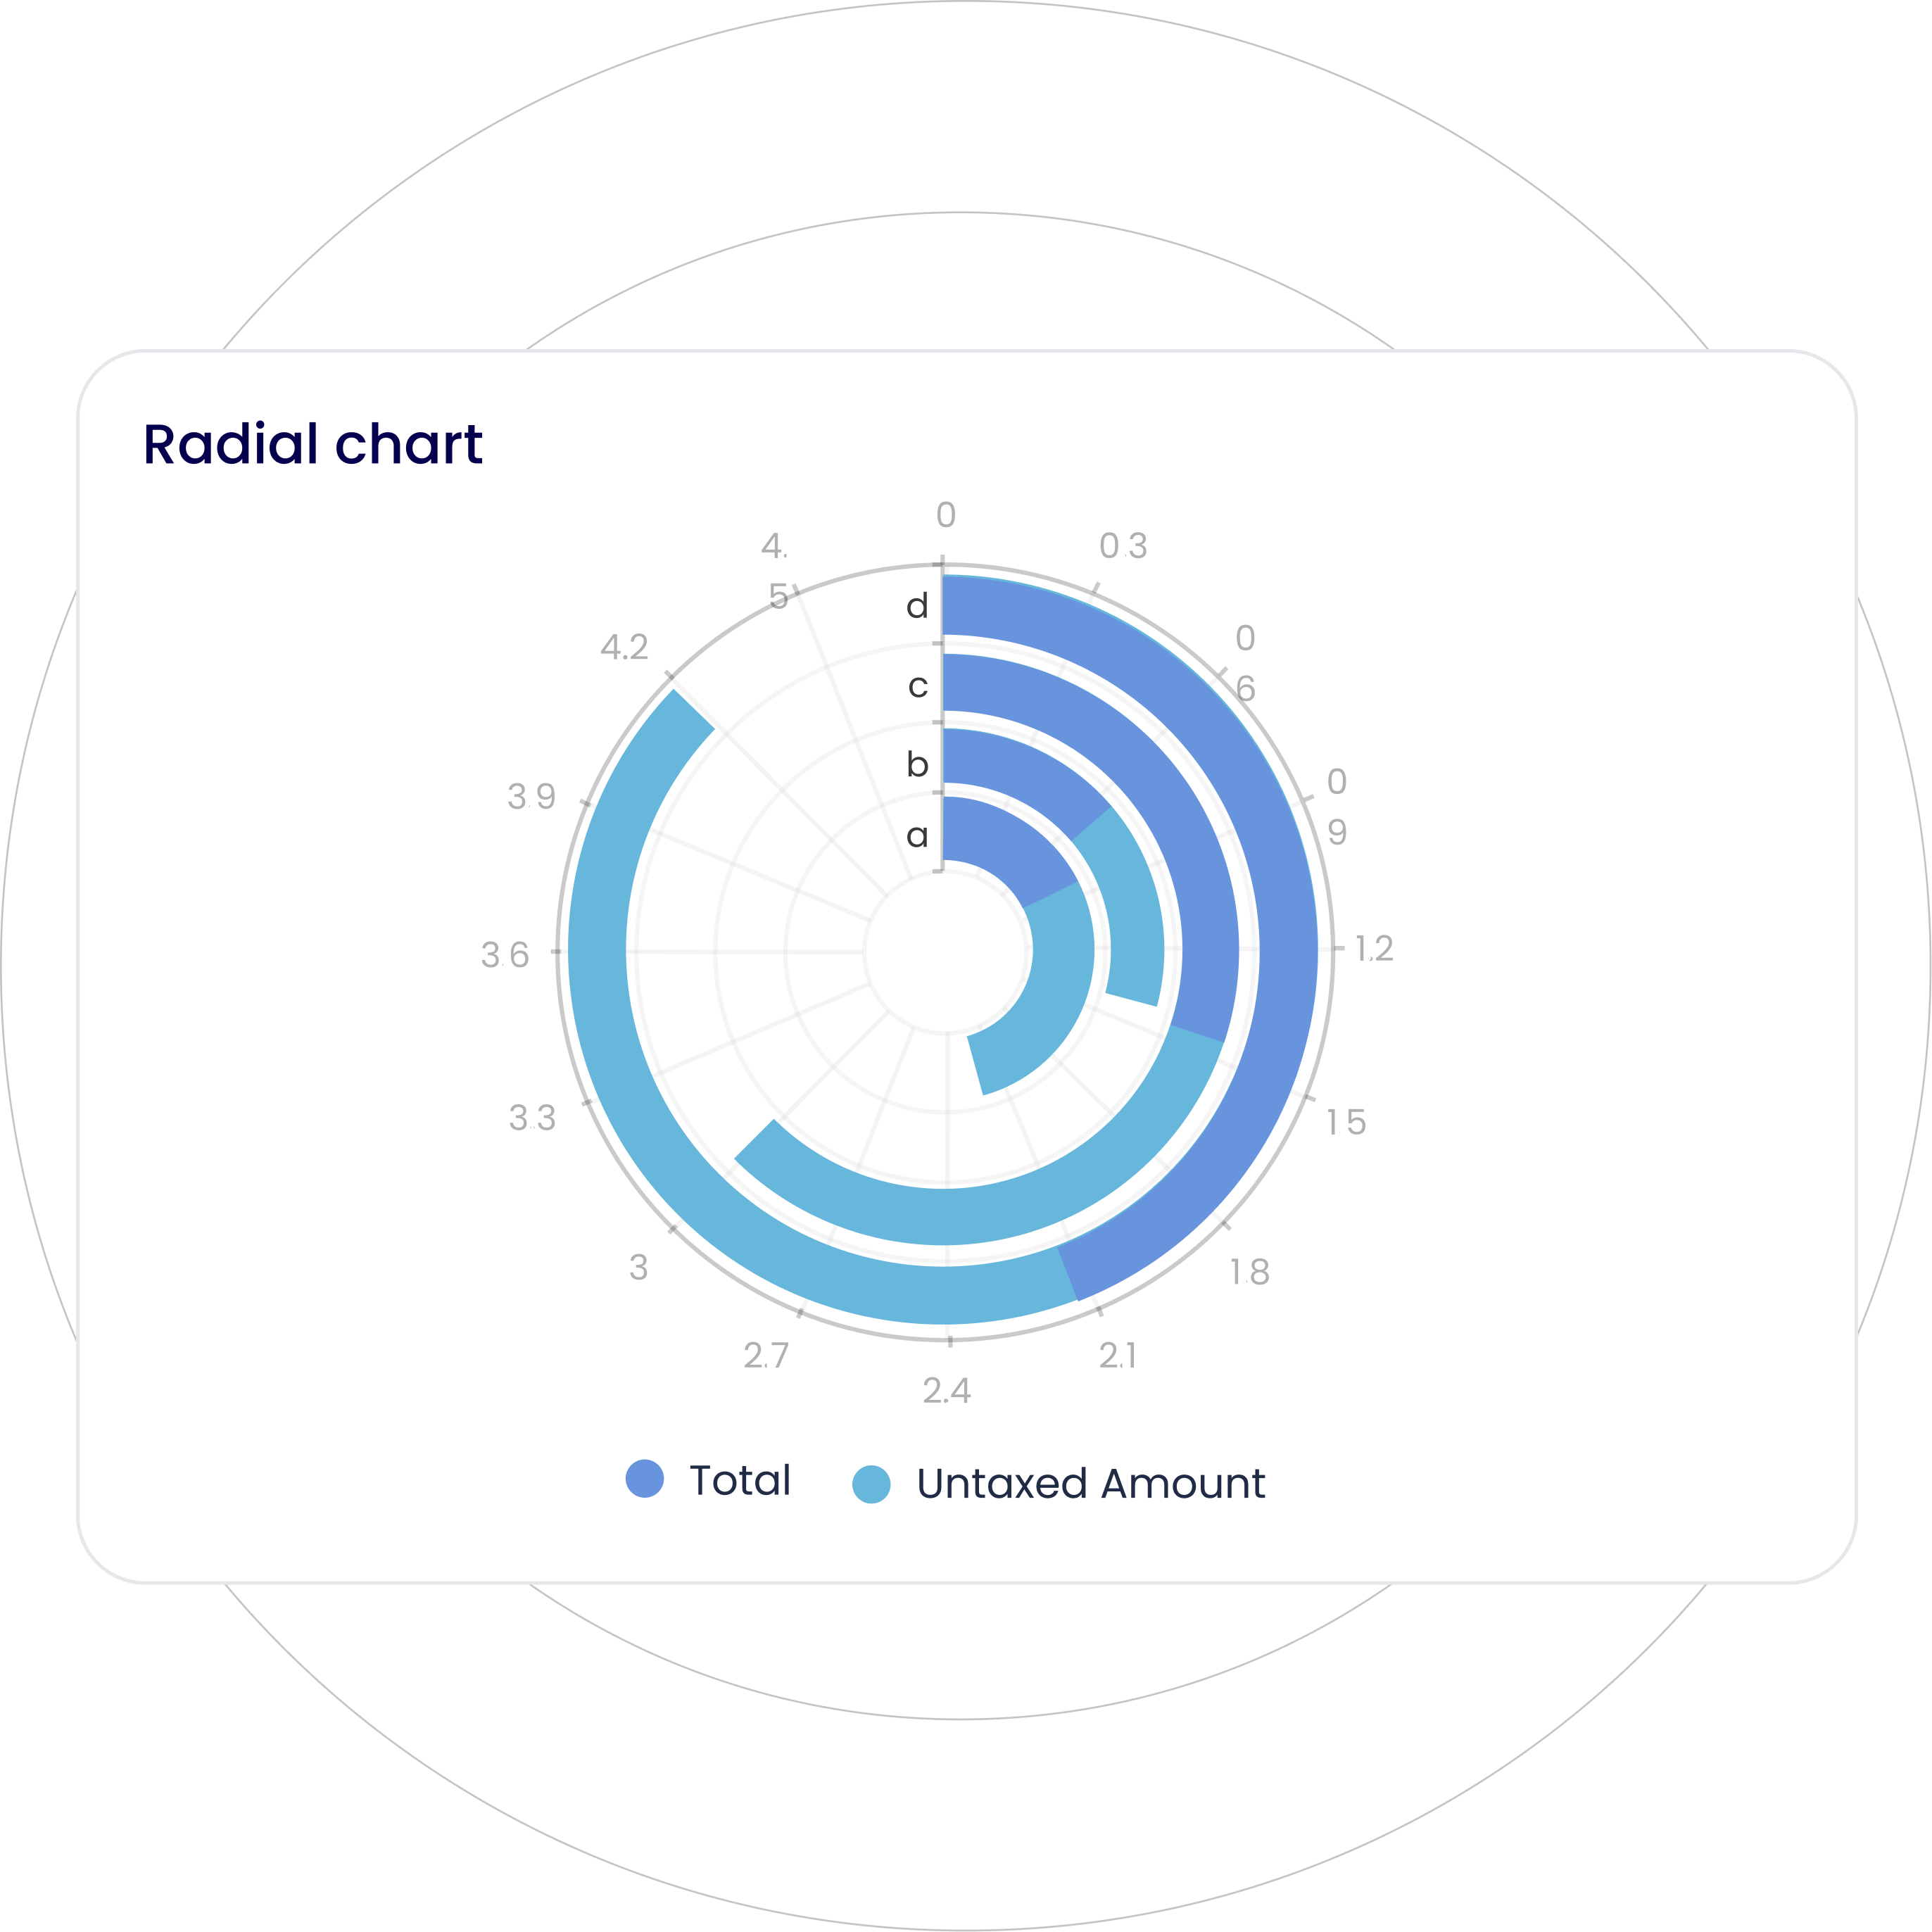
Represent multivariate data along concentric circles, where each circle represents a different variable or category.
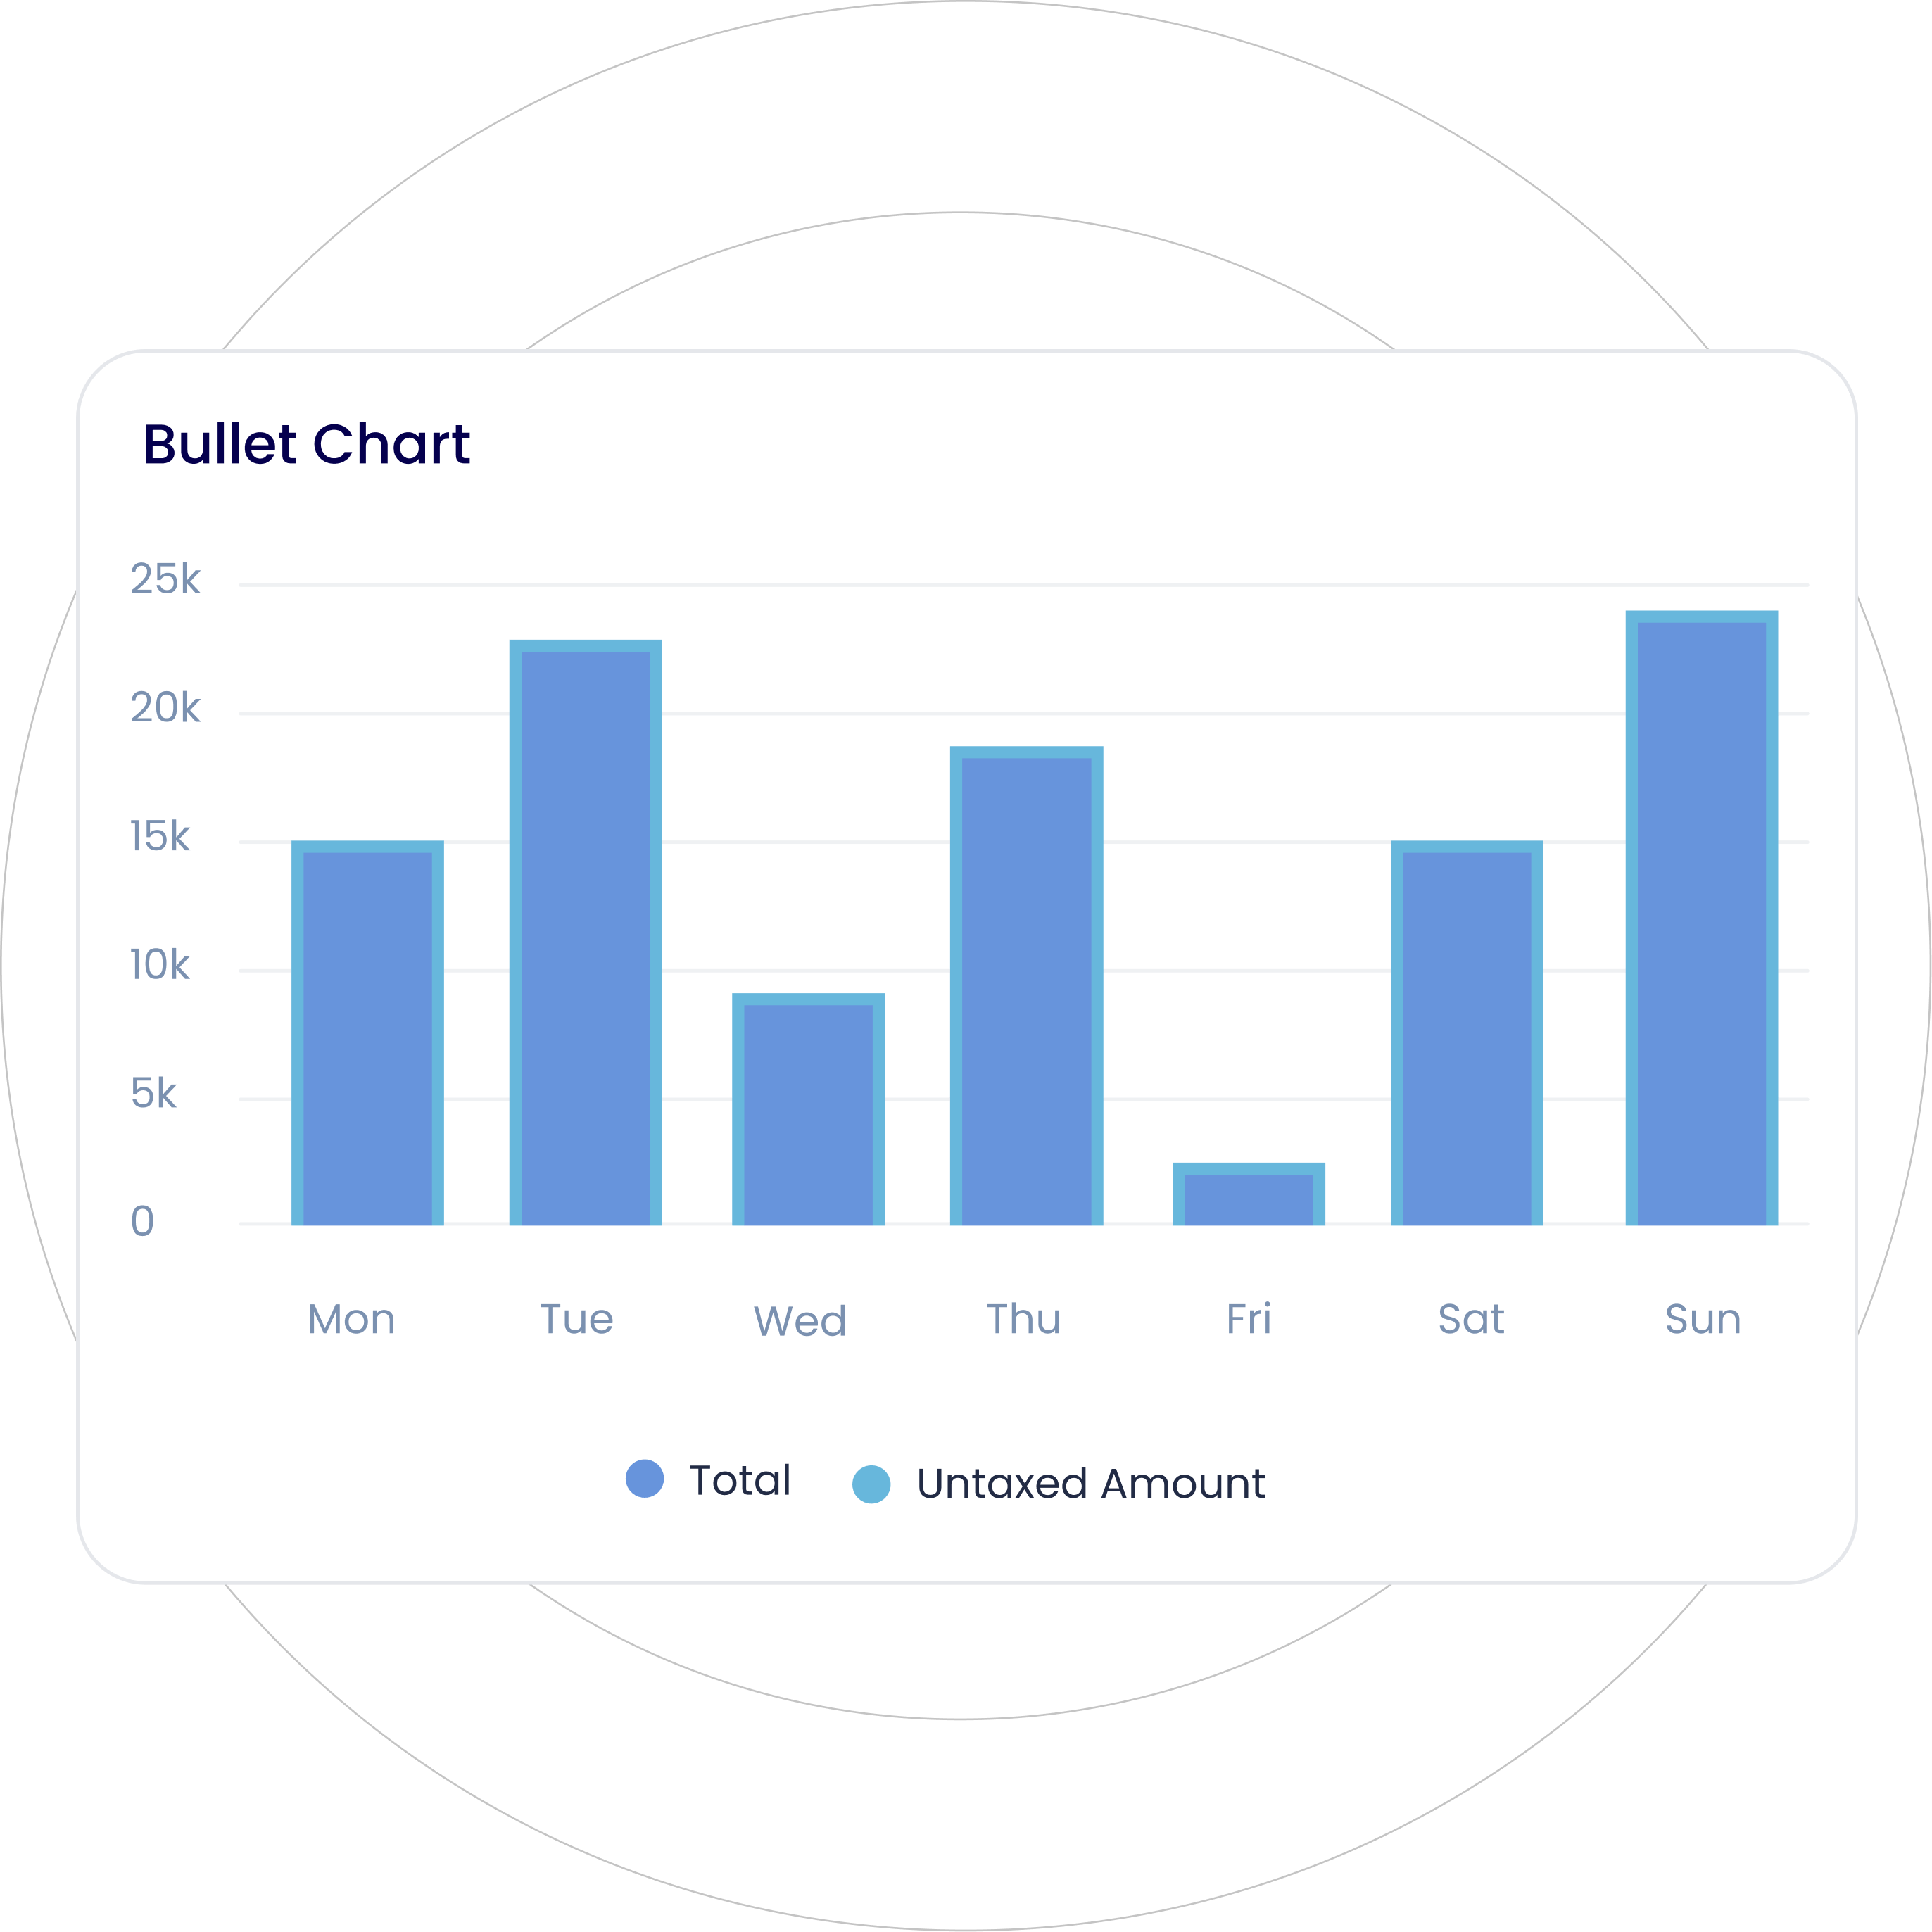
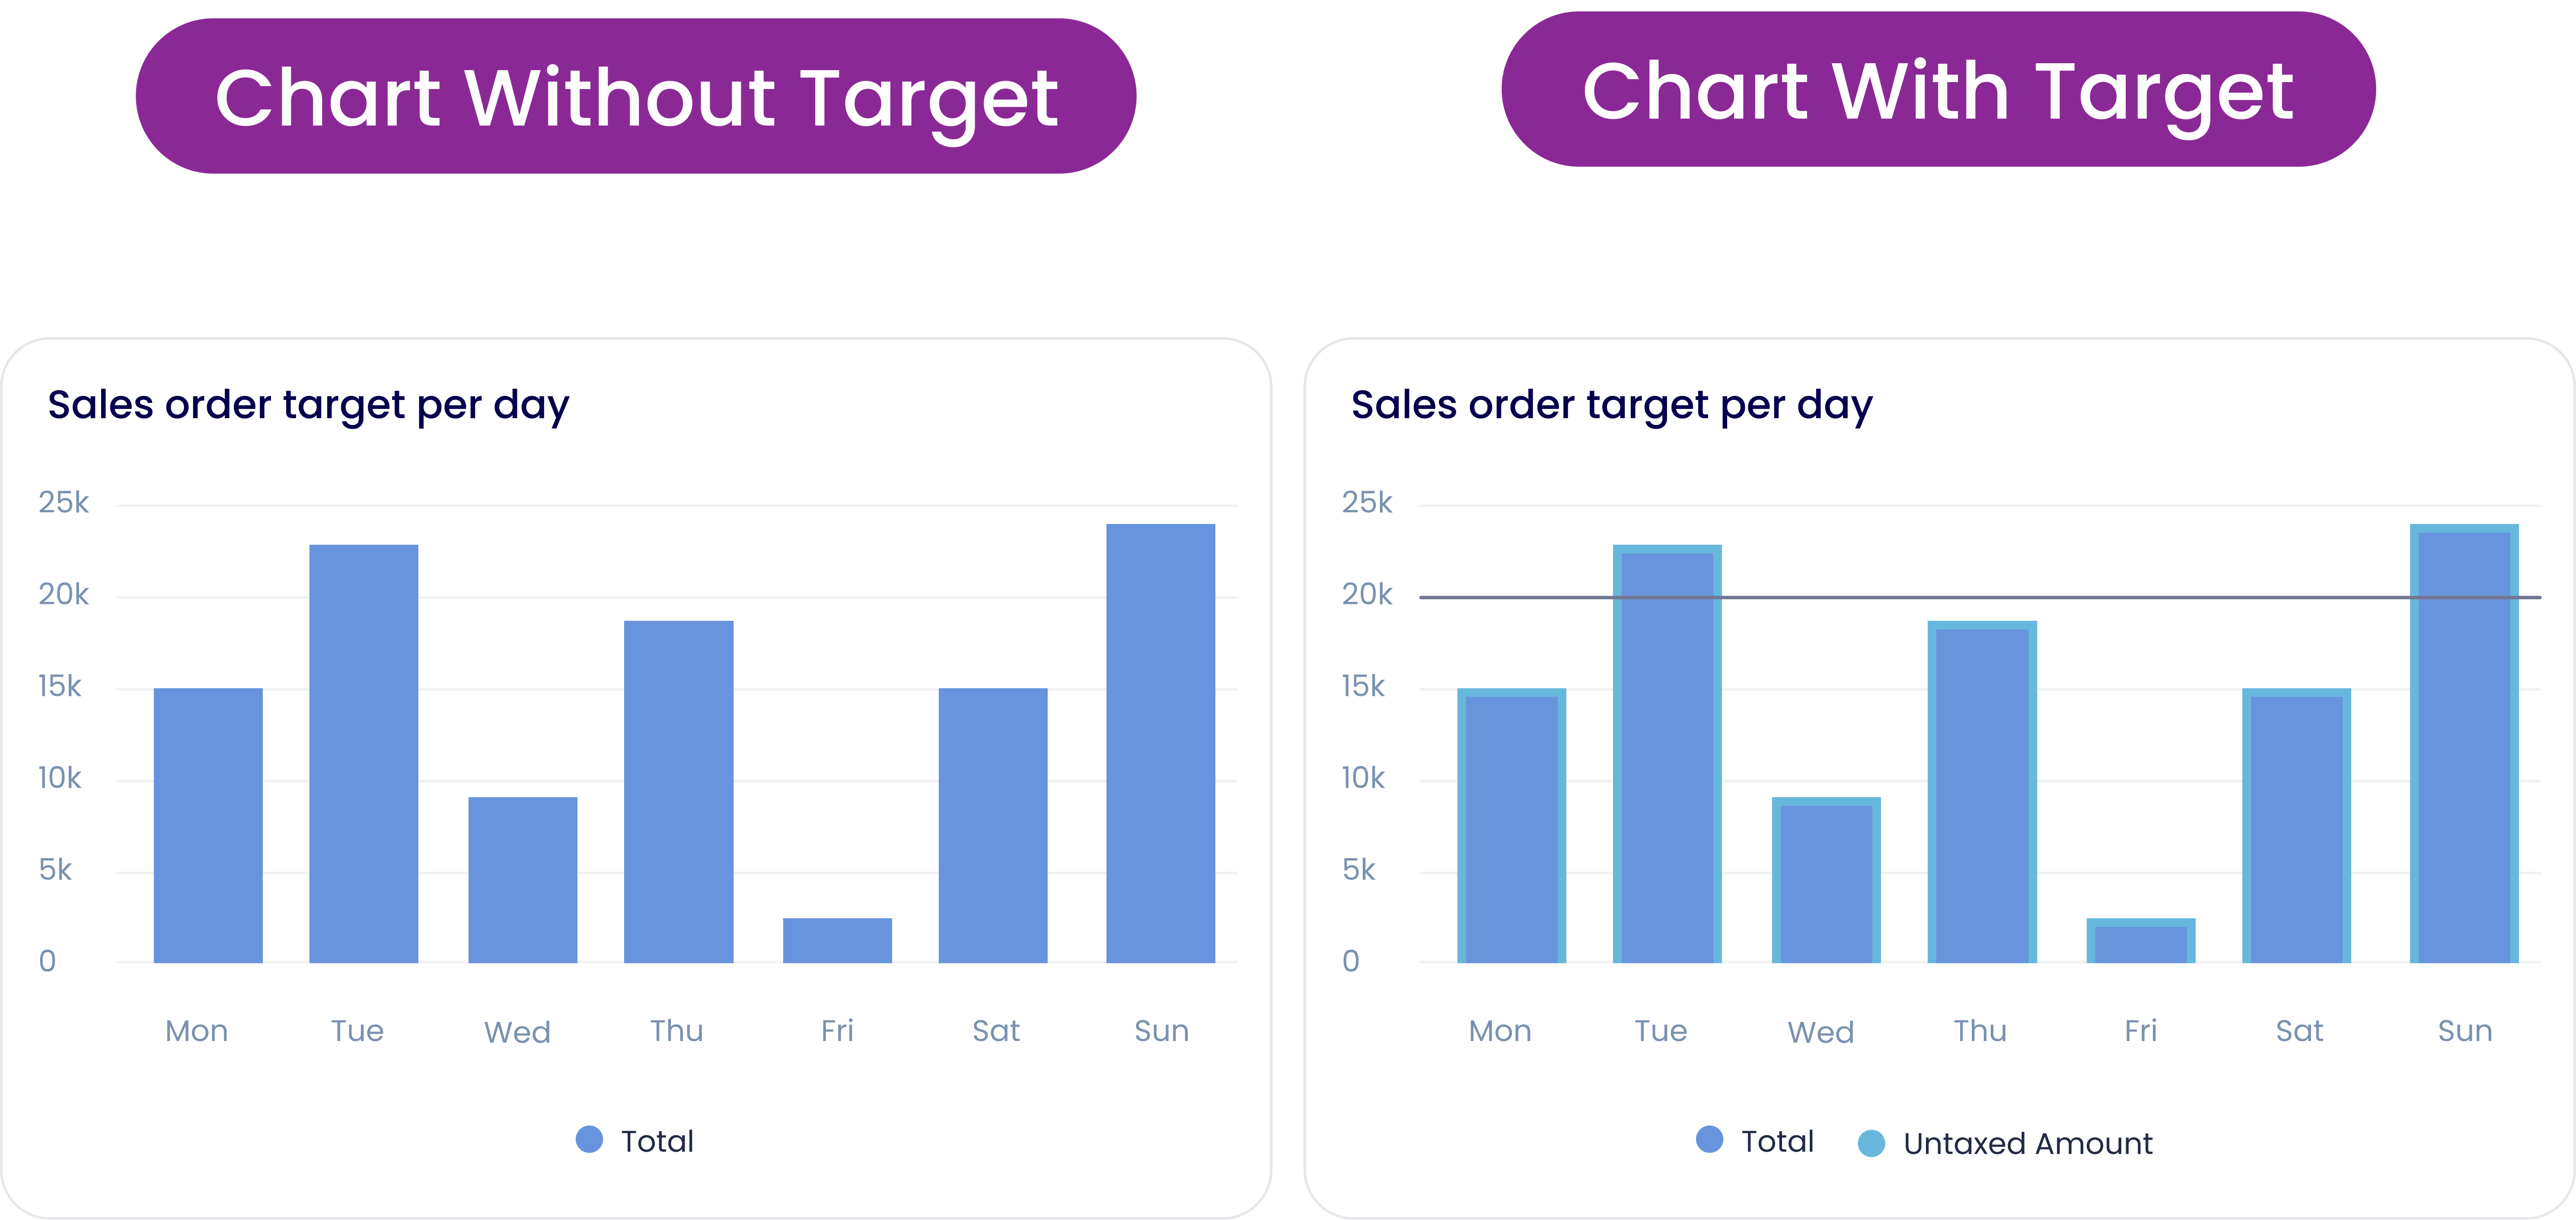
A variation of a bar chart with a reference line and markers to visualize performance against the target or benchmark.
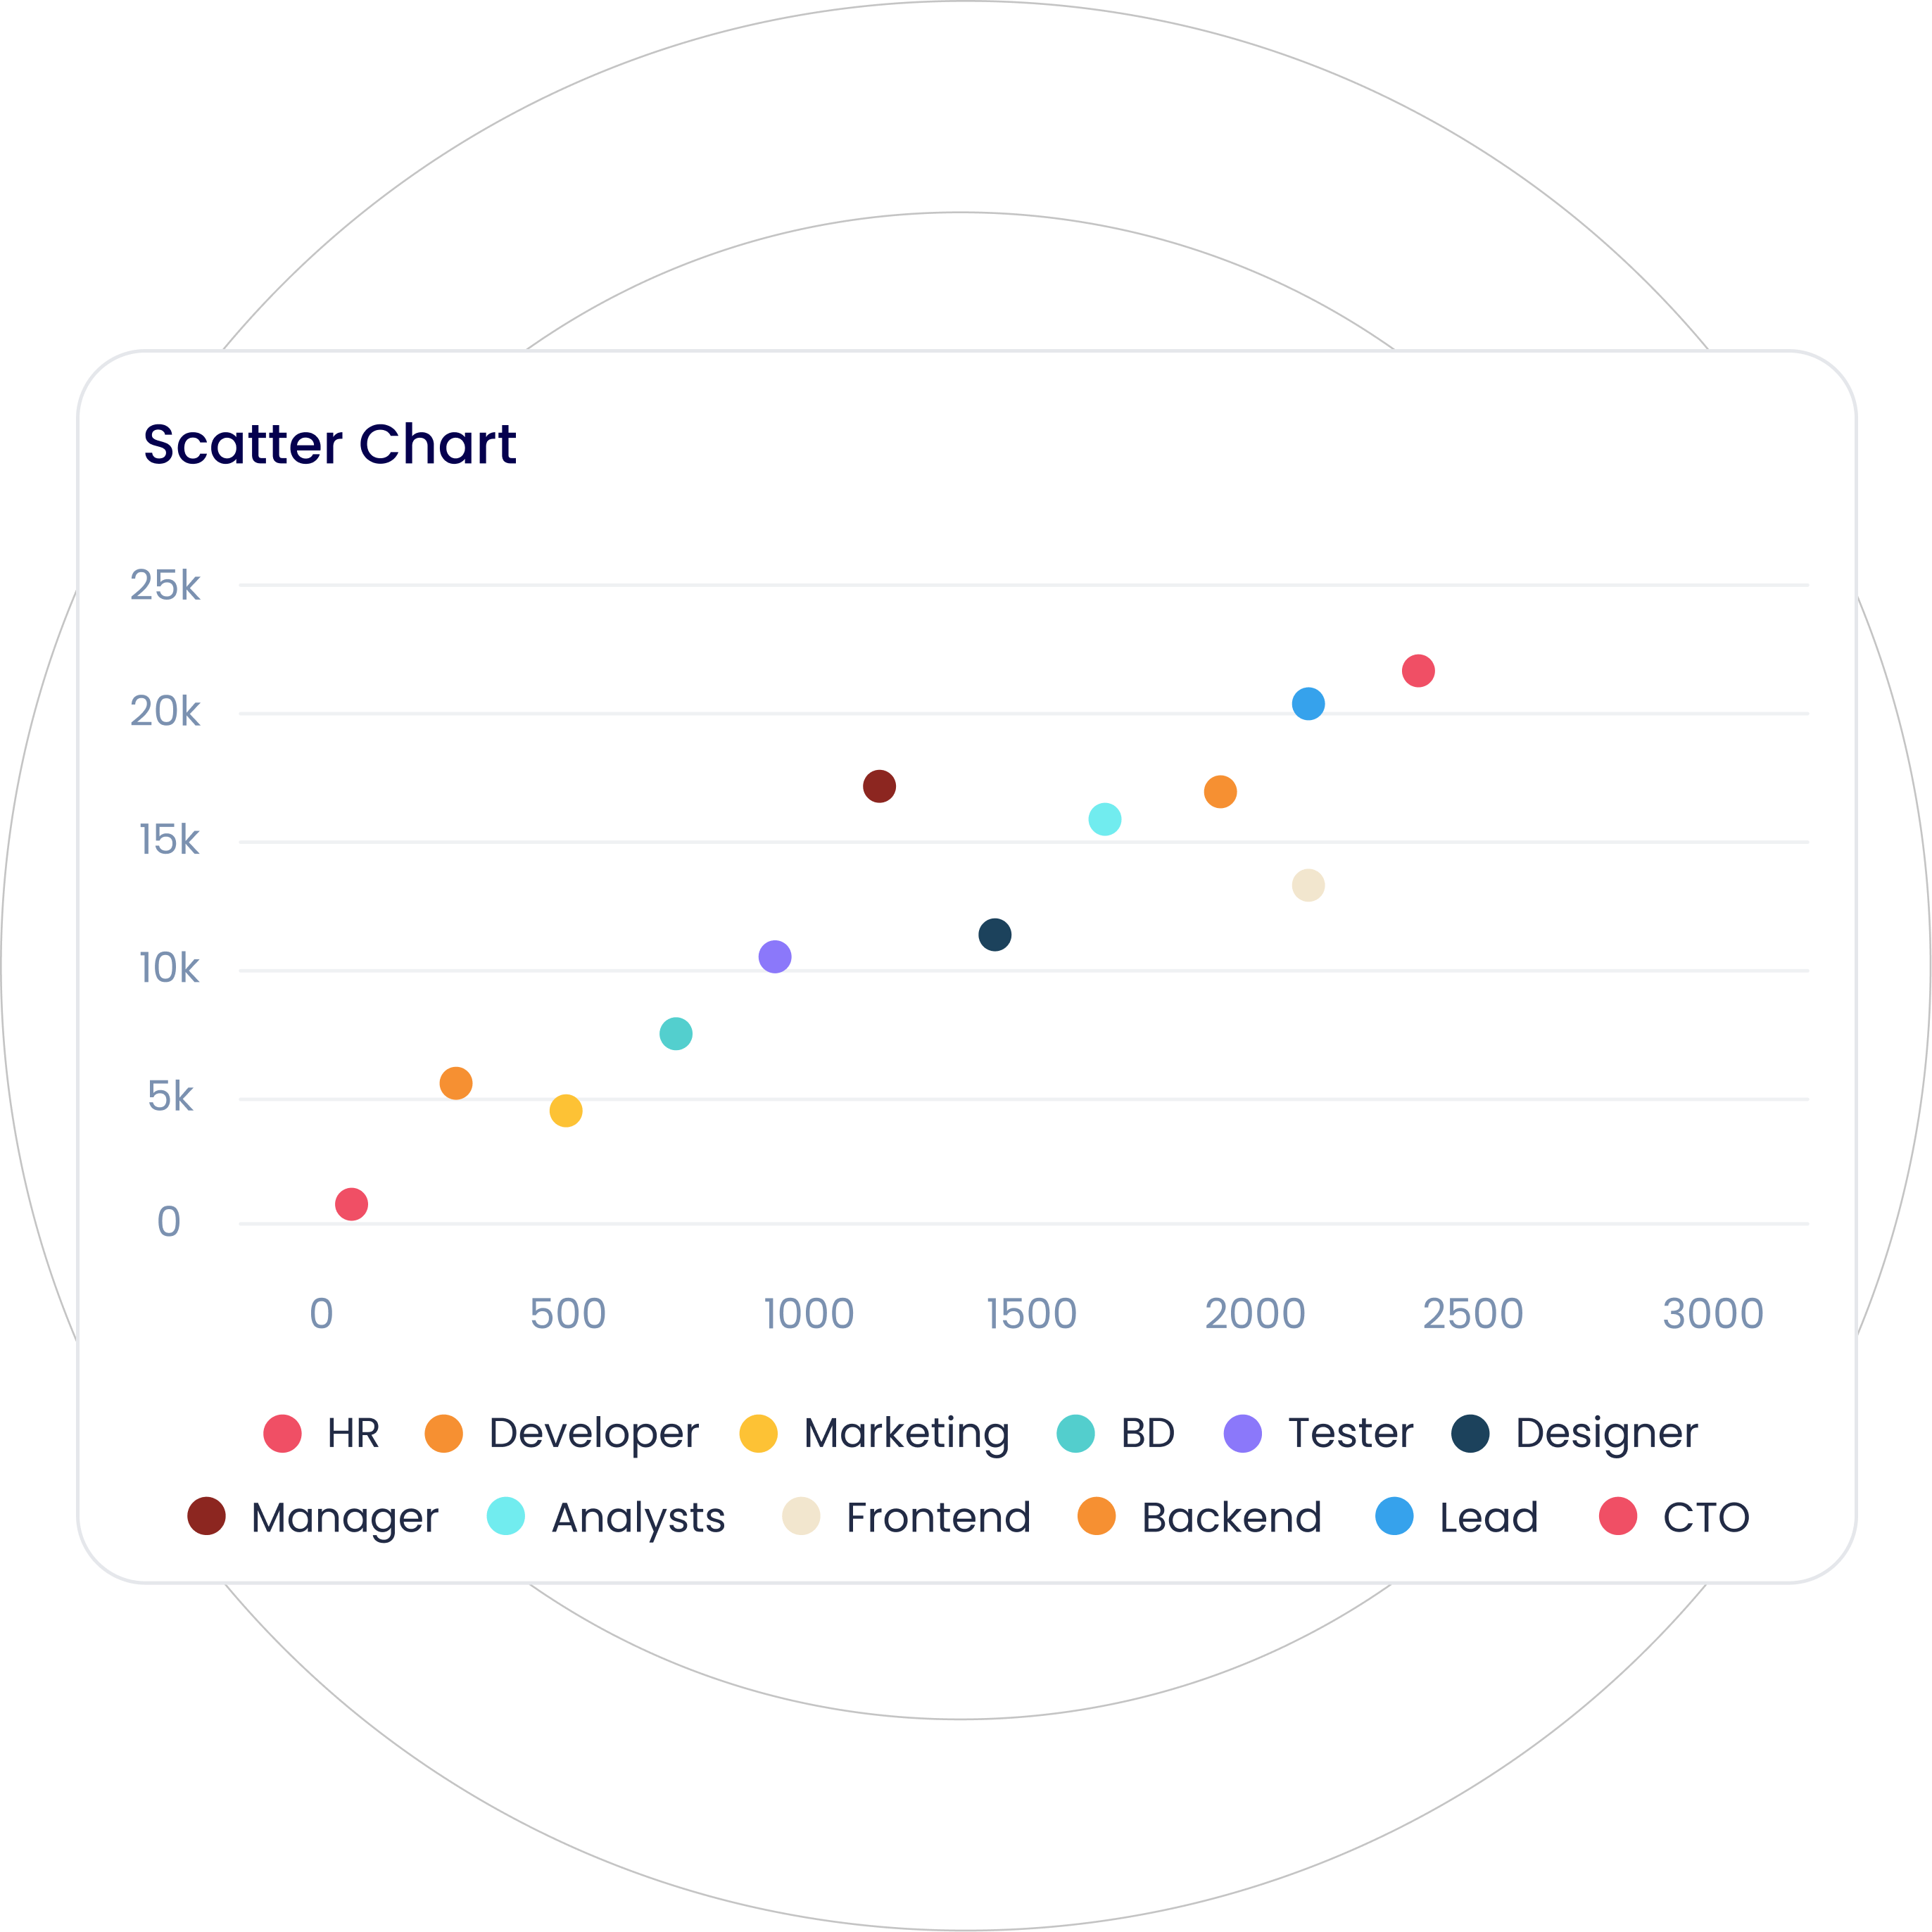
Visualize the relationship between two continuous variables of a data set, plotted across the X-Y axis.
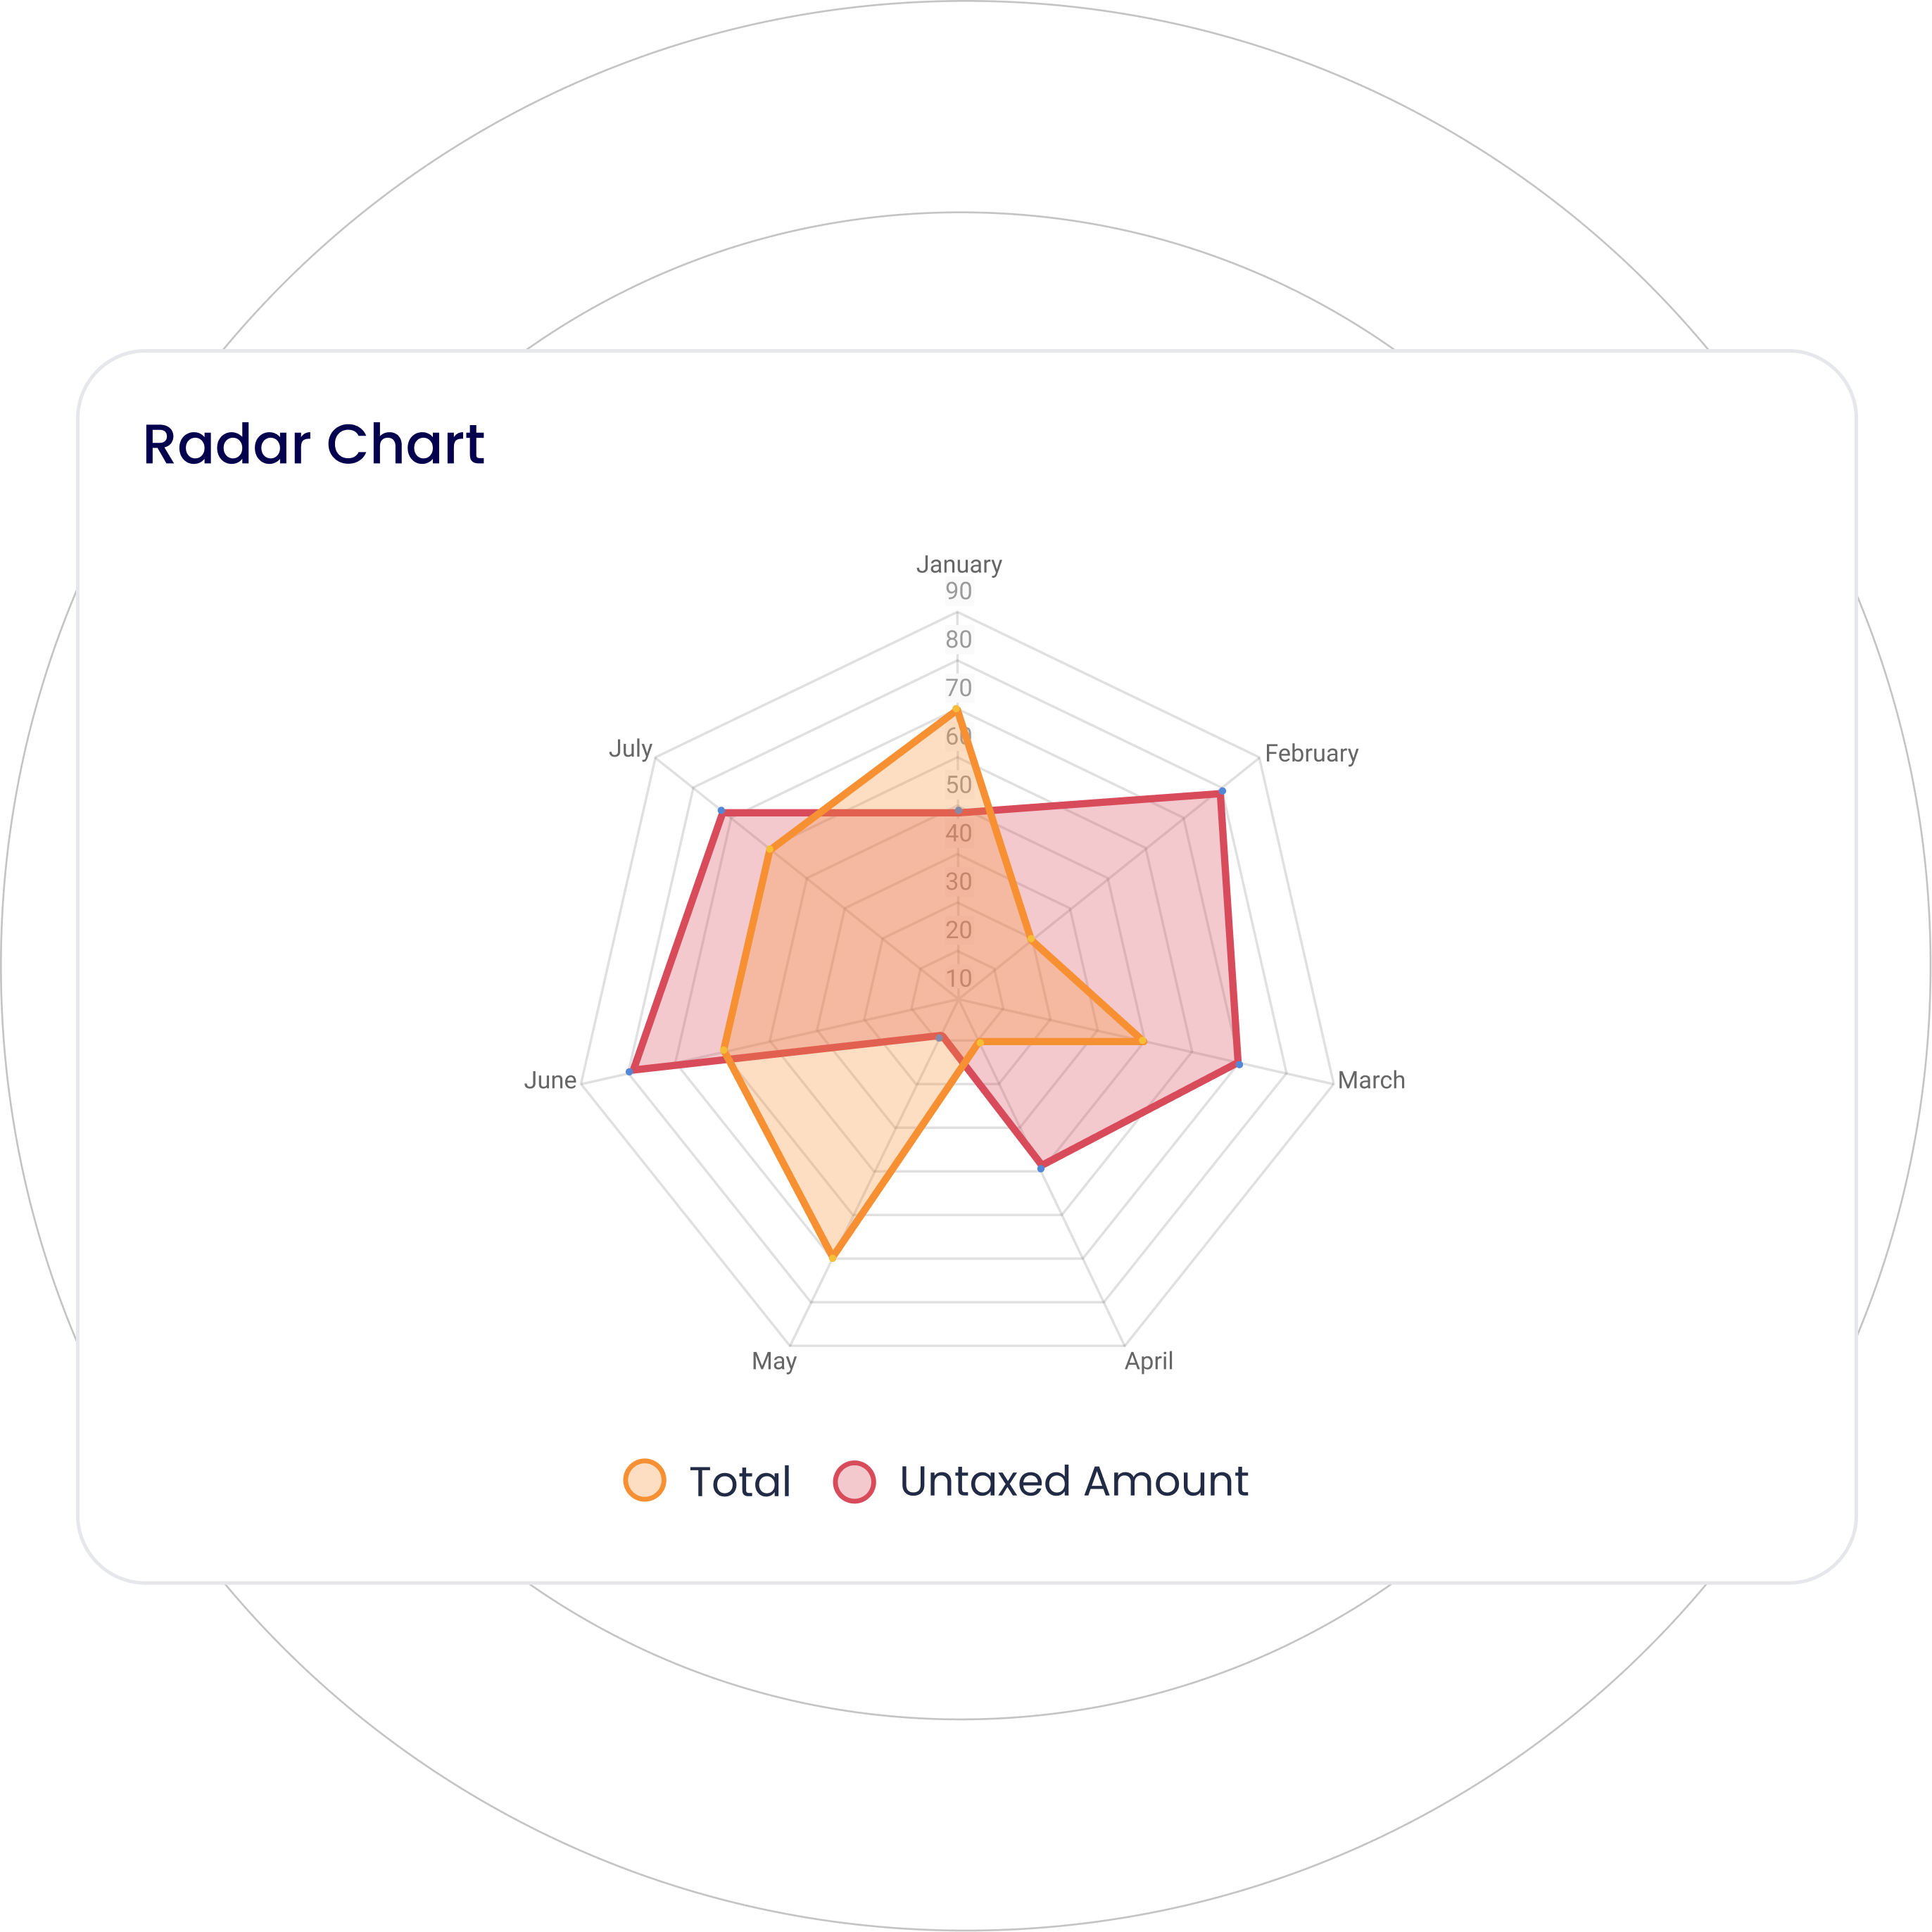
Display multivariate data stacked at an axis with the same central point, resembling a spider’s web.
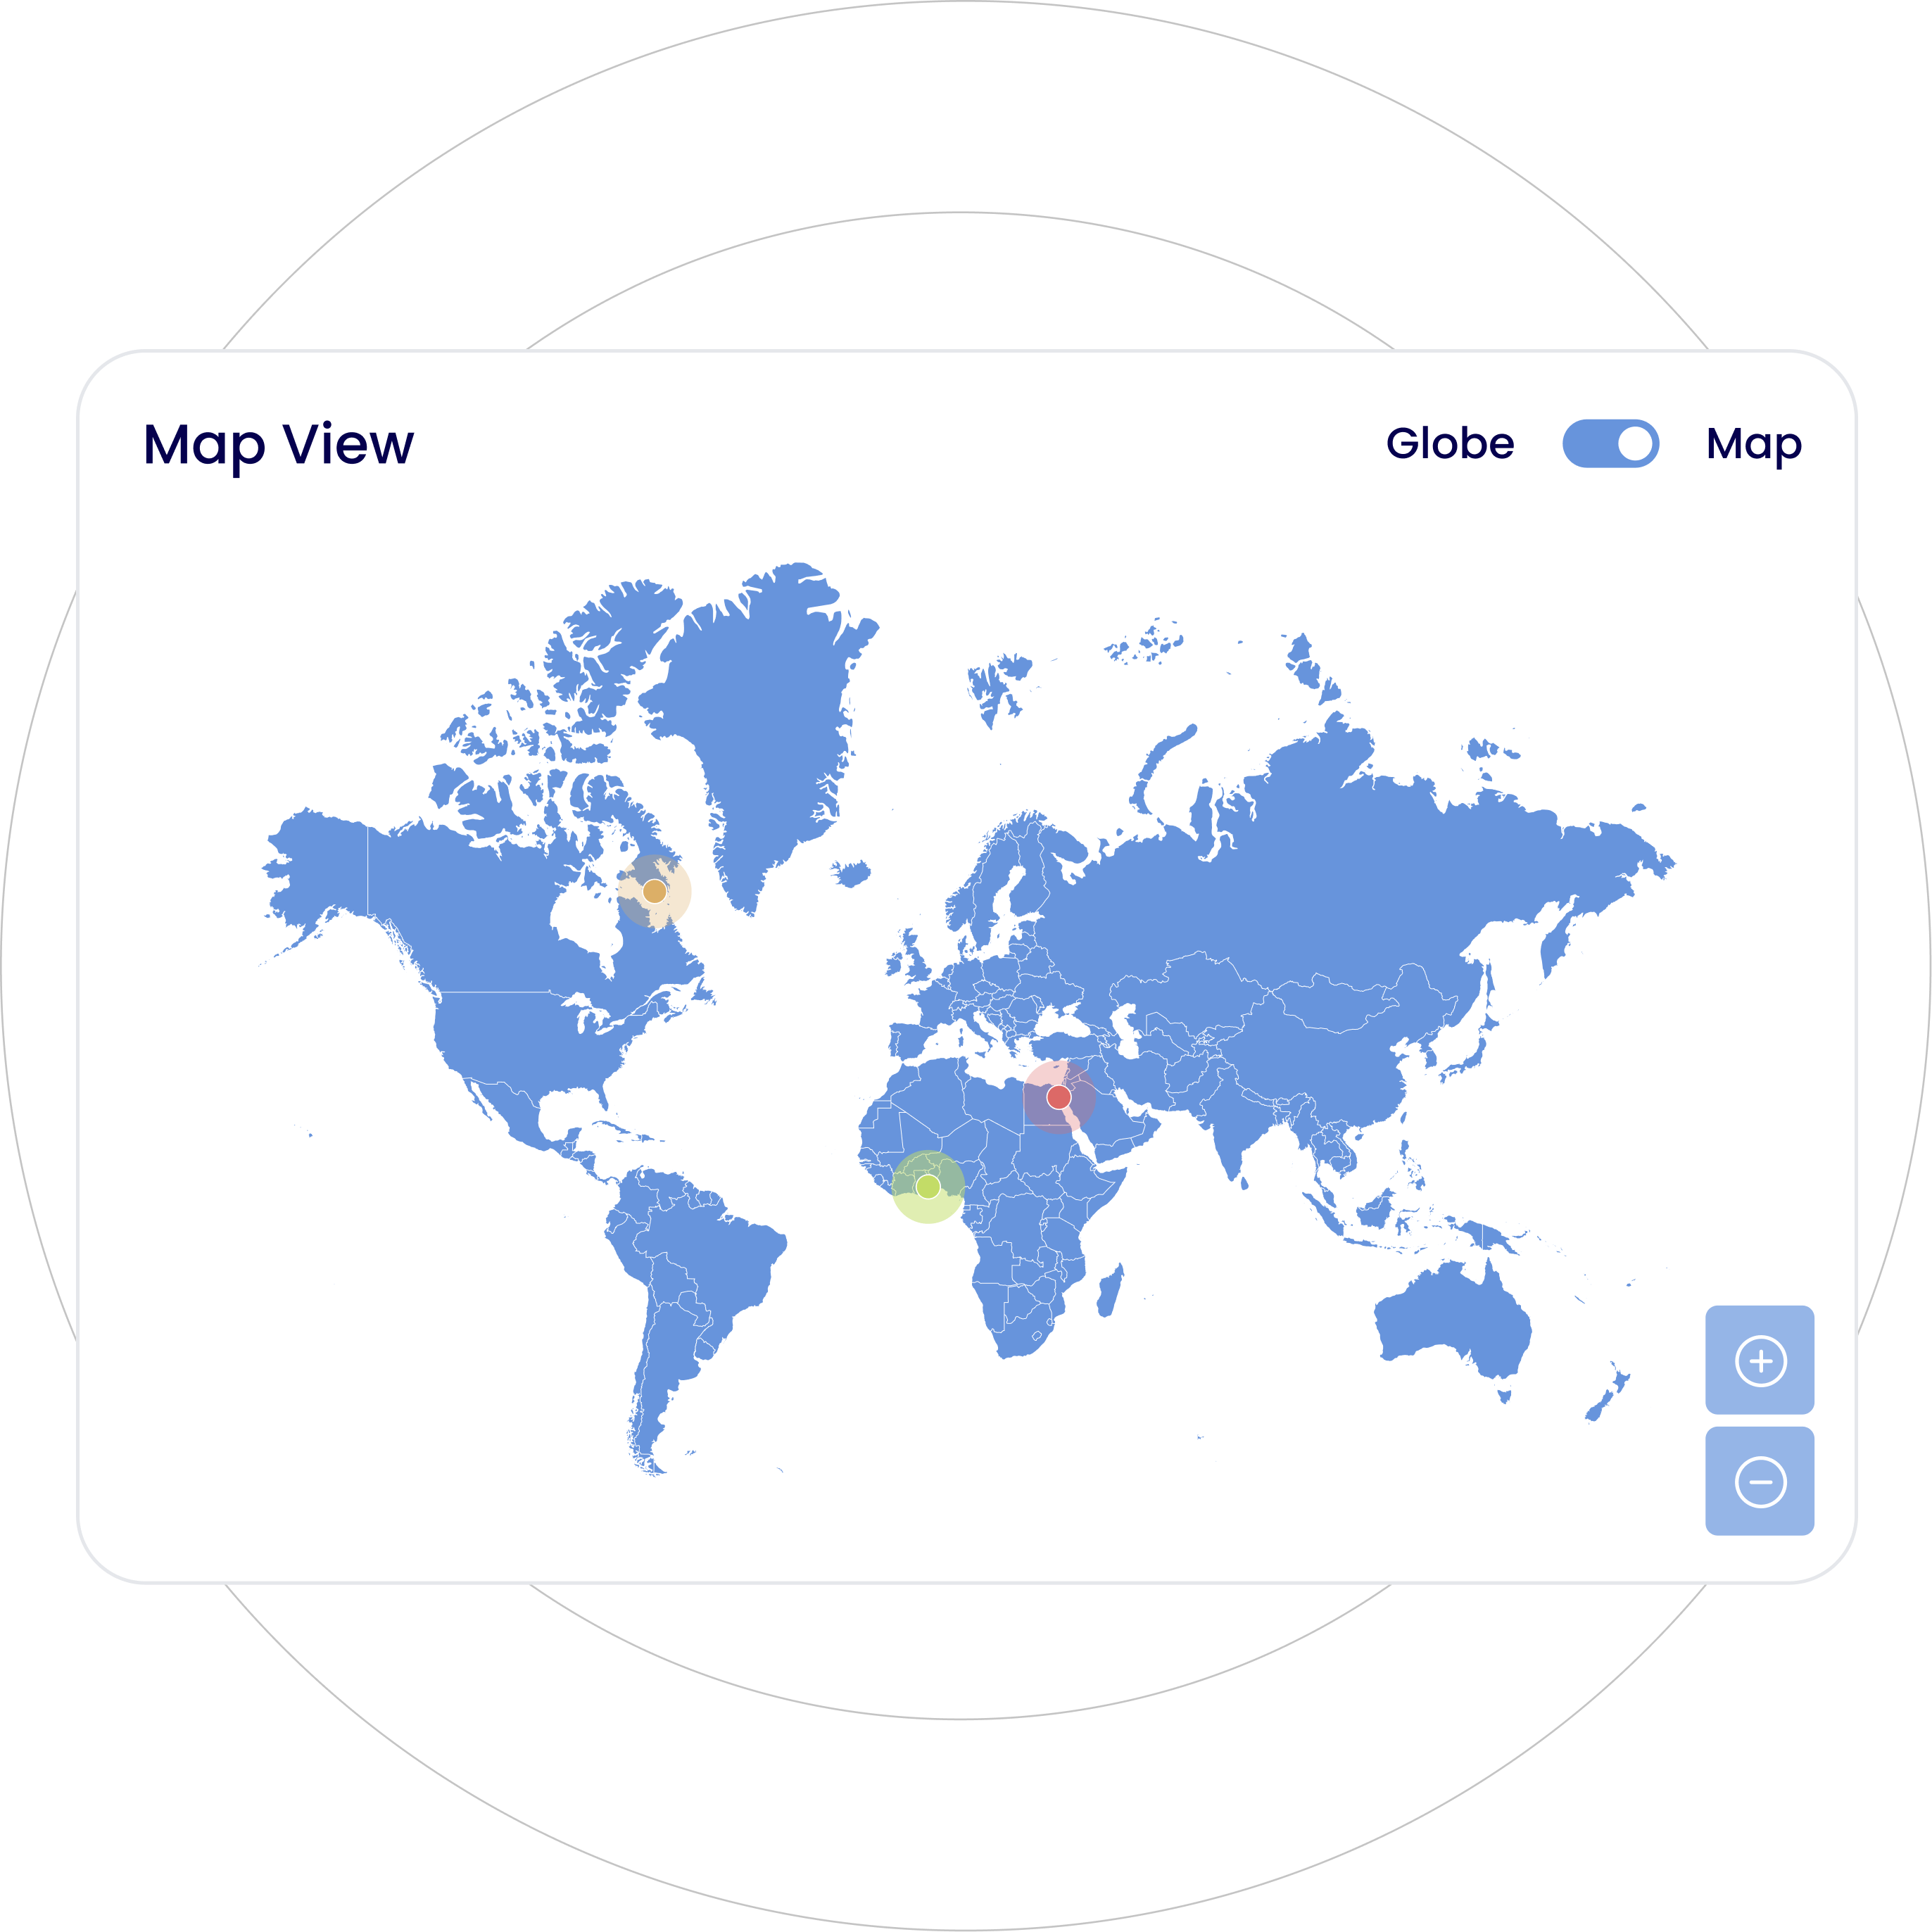
Visualize spatial data by plotting it on a geographical map for location-based analysis.
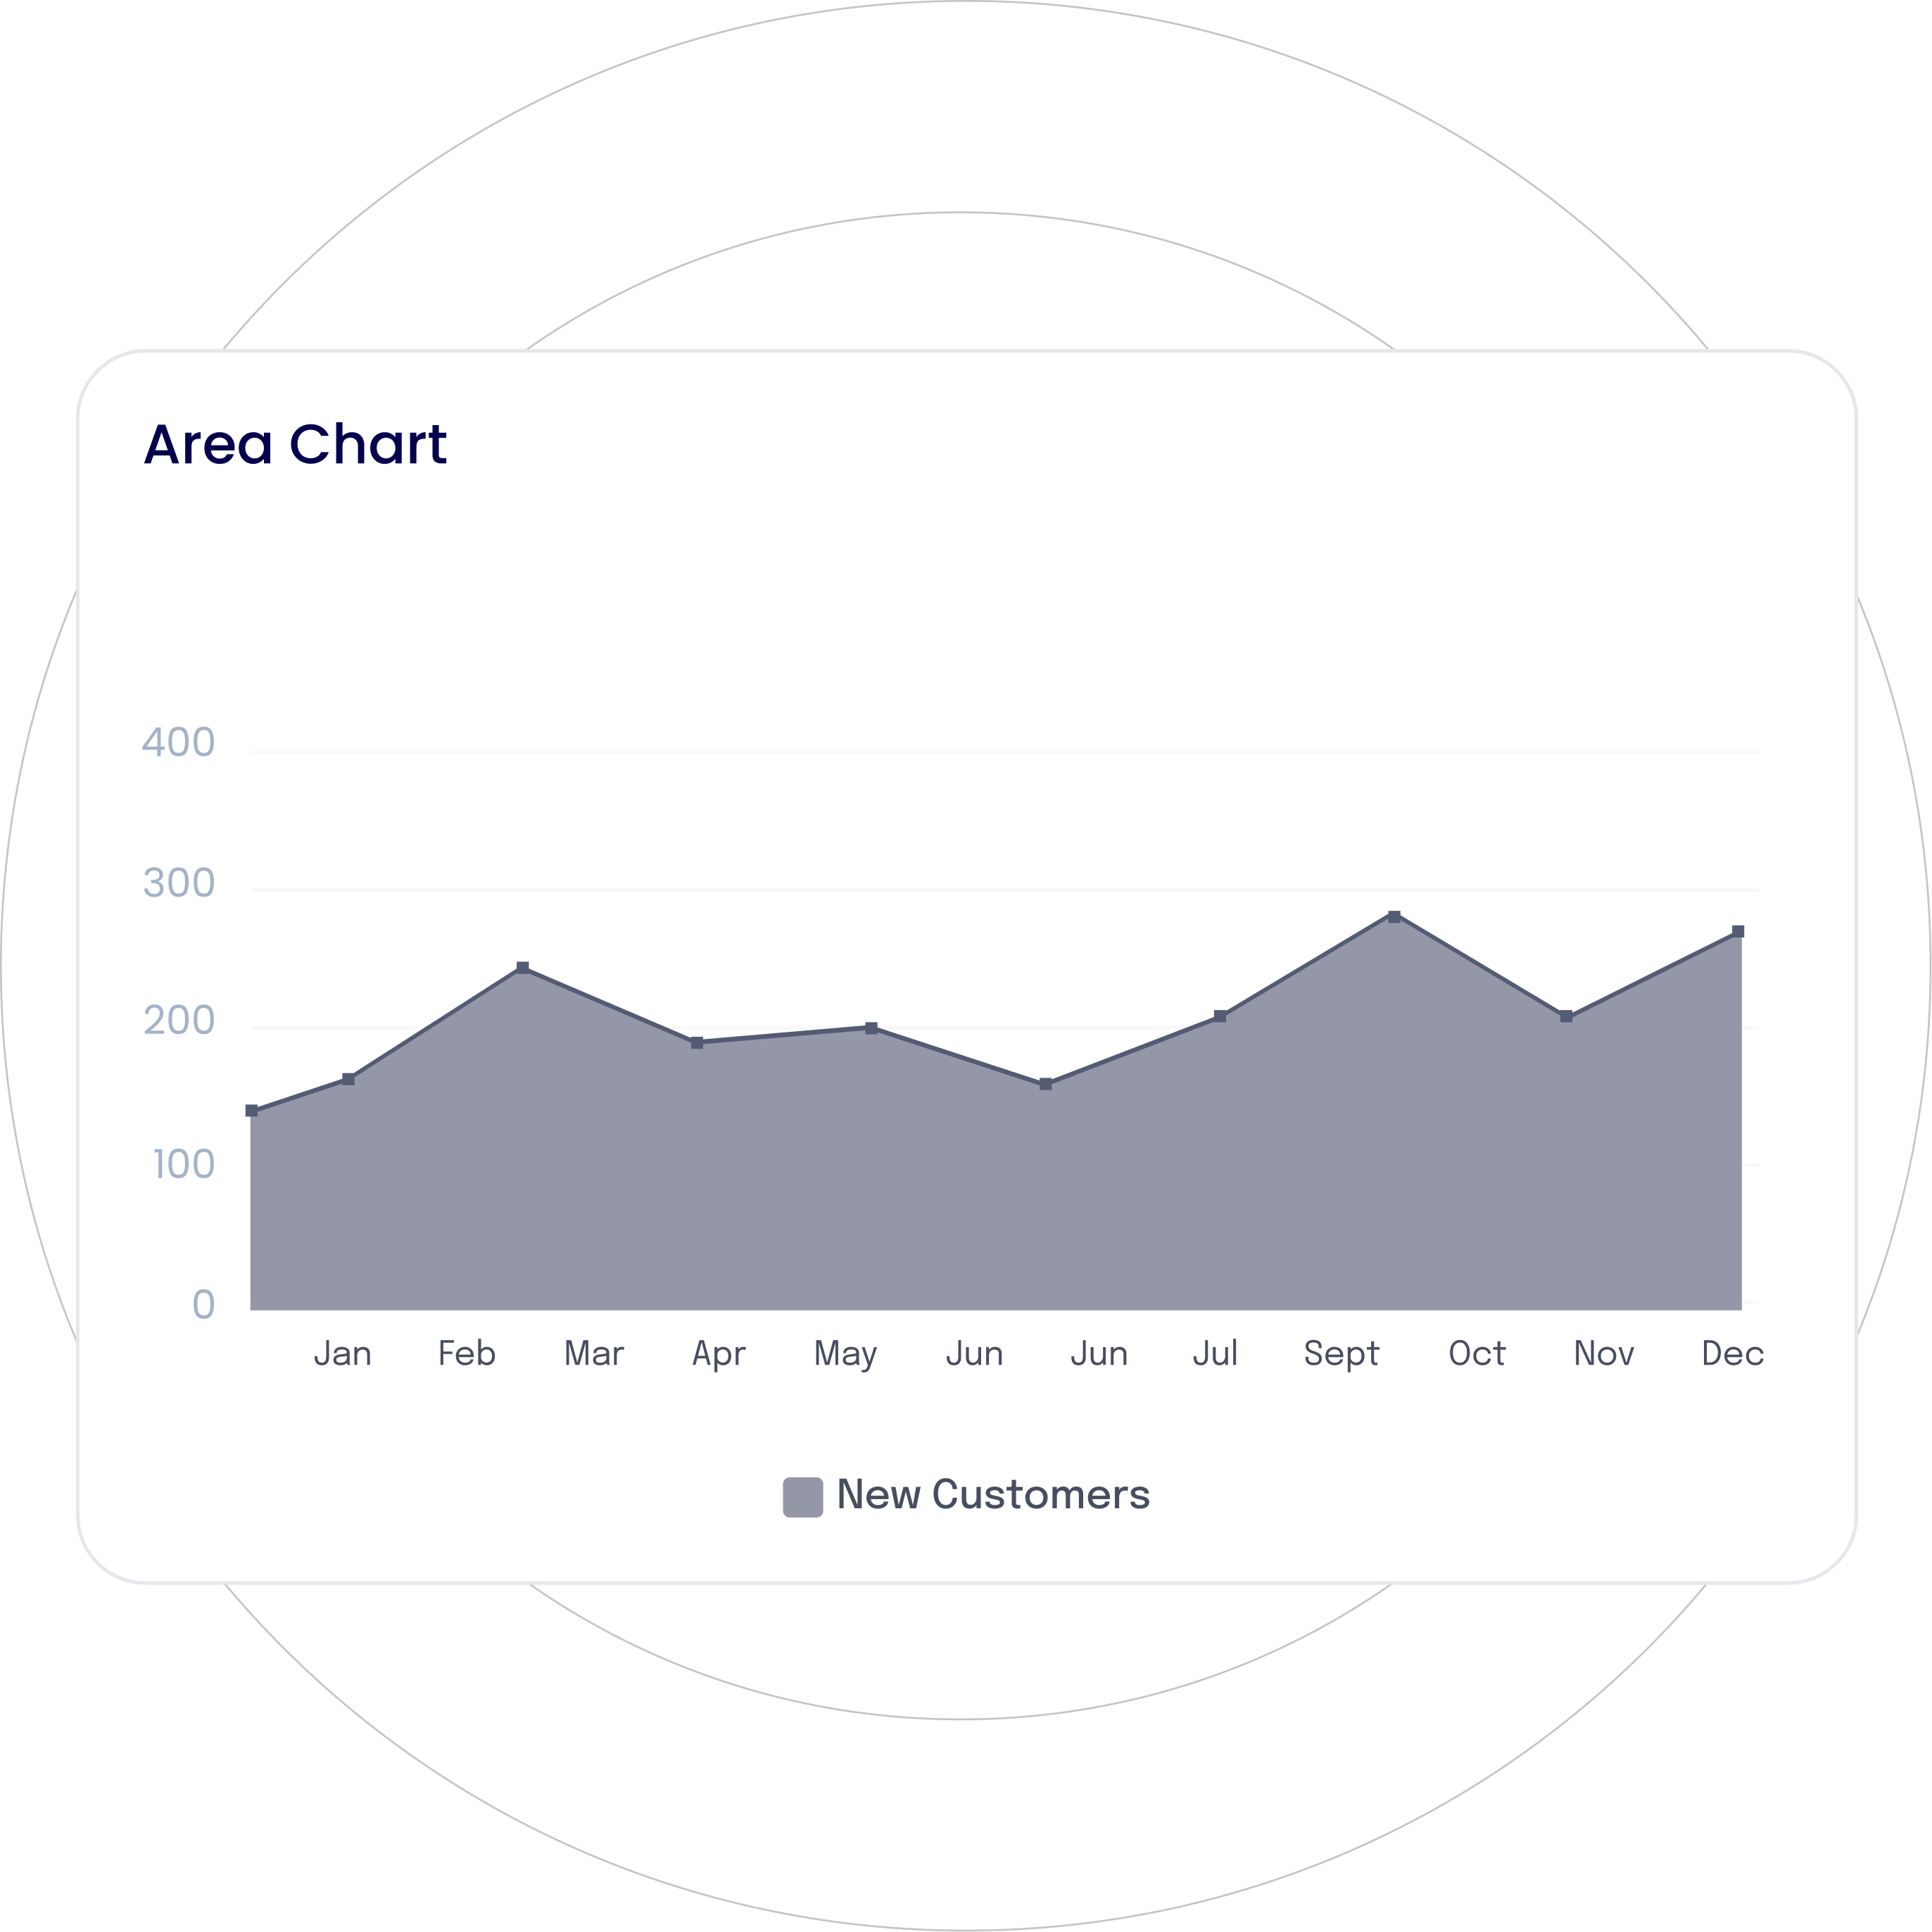
Display cumulative data by filling the area beneath the line chart, illustrating the changes over time or the magnitude of data.
Display key performance indicators (KIPs) in small square-shaped visualizations for a quick glance.
Visualize data trends, changes, or relationships over time by connecting data points with straight lines.
Present detailed data in a tabular format with rows and columns for easy sorting and comparison.
Visualize categorical data with rectangular vertical bars with the height proportionate to the value they represent.
Represent categorical data with rectangular horizontal bars, representing the difference between data categories.
Organize all tasks or actions that need to be completed in the form of a checklist, ensuring easy tracking of progress.
Represent cyclical data using radial lines separating segments, with each segment’s area representing its value.
Display your data in a circular graph, with each slice of a circle representing a fraction or proportionate part of the whole.
Similar to a pie chart with a central hole, providing a clean and modern look.
Visualize multivariate data wherein data points are displayed as petals radiating from a central point, with each petal’s size or color representing its value.
Visualize data as it moves through different stages of a process with decreasing segments. Ideal to visualize conversion rates or sales pipelines.
Represent multivariate data along concentric circles, where each circle represents a different variable or category.
A variation of a bar chart with a reference line and markers to visualize performance against the target or benchmark.
Visualize the relationship between two continuous variables of a data set, plotted across the X-Y axis.
Display multivariate data stacked at an axis with the same central point, resembling a spider’s web.
Visualize spatial data by plotting it on a geographical map for location-based analysis.
Display cumulative data by filling the area beneath the line chart, illustrating the changes over time or the magnitude of data.
What makes Odoo Dashboard Ninja Unique
The ultimate time and money saving Odoo tool for your Business.
Unleash the Power of AI in
Your
Odoo Dashboard
Generate smart, interactive charts with a single click.

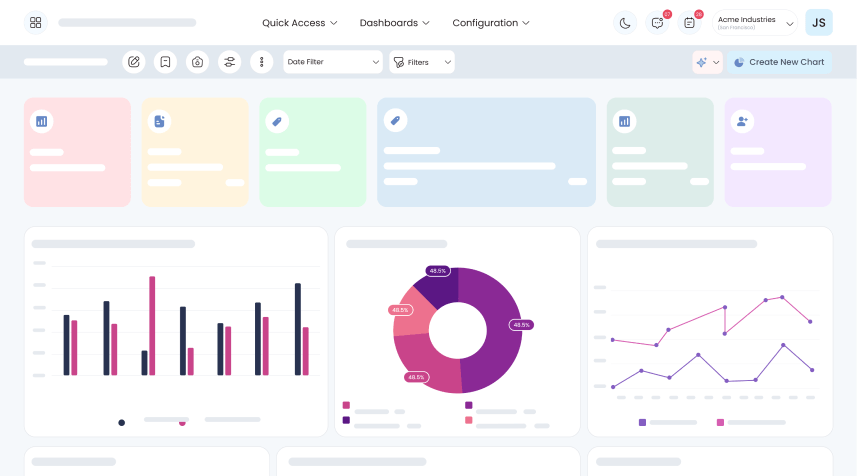


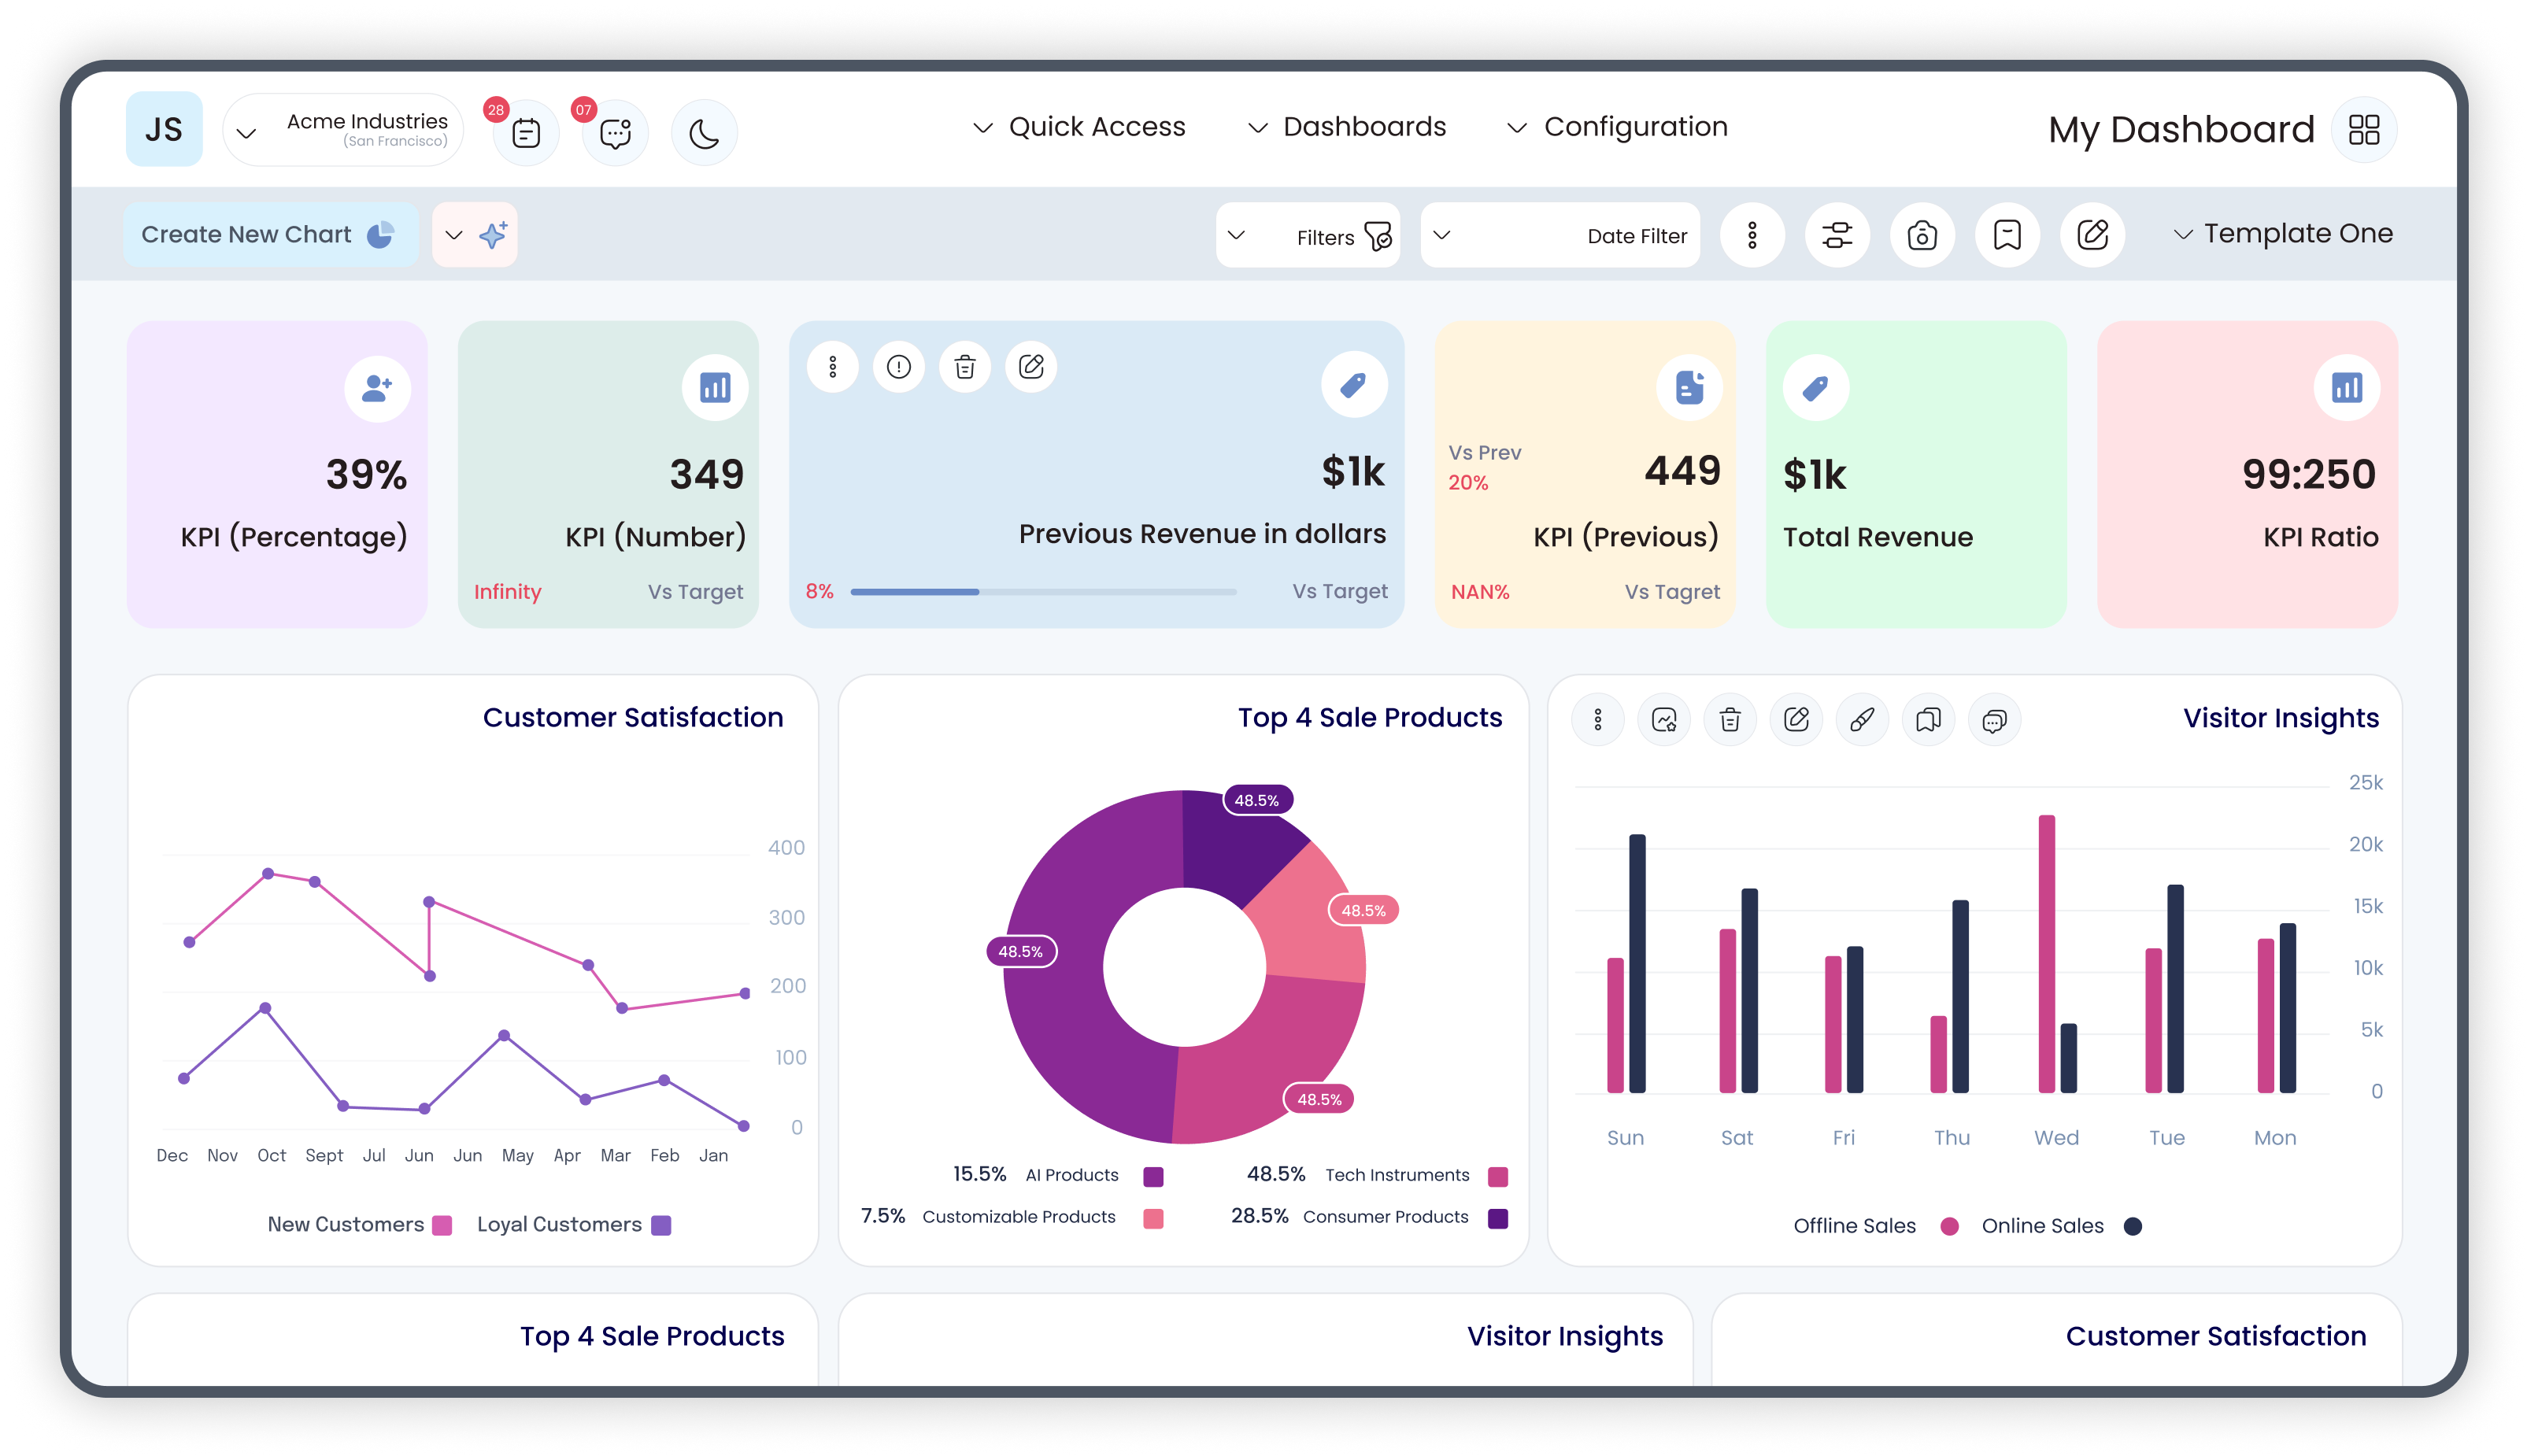
Revamp Your Odoo Apps Dashboard Like Never Before
Upgrade to a modern, intuitive, and scalable interface.

Free 90 Days Support
Ksolves will provide FREE 90 days support for any doubt, queries, and bug fixing (excluding data recovery) or any type of issues related to this module. This is applicable from the date of purchase.


Why Ksolves
You know us as the makers of the Odoo "Dashboard Ninja" . .
You know us as the makers of the Odoo "Dashboard Ninja" . .

Client Success
Invest your trust like our elite clientele did!


Products That Blends Together
Related Products You May Be Interested In!
|
|

Perfect Combo
|


Go Beyond Ordinary with
Ksolves Odoo Solutions
Peerless, powerful, and personalized apps to streamline every workflow.
Ksolves Suggested Apps
Take a look at our other Odoo apps designed to
make your life easier with a smooth workflow. Don’t
miss the chance to uplift your Odoo ERP experience
with our apps!
Dashboard Ninja
Advance
Dashboard Ninja Advance breaks all the limitations of productivity by simplifying complex data into attractive charts...
Learn More
List View
Manager
An app which manages the List Views on the fly and endeavor a quick and effortless way to view/manage the desired data, where you’ve multifarious options to...
Learn More
Odoo
Wocommerce
Connector
Connect multiple WooCommerce stores to the Odoo ERP and reach more customers with our high-end WooCommerce Connector.
Learn More
Arc Backend
Theme

Bring productivity and enthusiasm into your work by applying the Odoo Arc Backend Theme.
Learn More
Odoo Gantt
View Base
Gantt View Base is the fundamental framework that creates the groundwork for using Gantt View. It works as a prerequisite for using...
Learn More
Report
Mate
ReportMate extracts all the needed information for all the fields of any Odoo Model and displays complex data in a single view...
Learn More
Dynamic
Financial
Report
With a comprehensive list of financial reports, Dynamic Financial Report has carved out its niche among the elite bookkeeping...
Learn More
Odoo Shopify
Connector
Keep hurdles away from the way of your business with a highly effective eCommerce management solution...
Learn More
Access Manager
Ninja

Streamline your workflow and save valuable time and effort by implementing Instant Access, a cutting-edge management application...
Learn More
Odoo Gmail
Connector

Sync all your Google mails in your Odoo account without any hassle by using the Ksolves Gmail Connector! This integration allows you to manage emails...
Learn MoreKsolves Odoo Services
Upscale your business with expert services from an Odoo Gold Partner.
Website Application
Development

Module Development

Theme Development
Implementation
Customization
Integration
Migration

Support &
Maintenance

Consulting
What our Clients say
Our clients love us! Hear from those who have made data-driven decisions with Dashboard Ninja.
Satisfy with support
Exceptional application and outstanding customer care indeed. My experience with them was truly remarkable, and I highly recommend their services to anyone looking for top-tier solutions.

Very helpful and patient
They were very easy to schedule time with and when I got on the call, they answered all my questions. They also understood beyond my questions and showed me some features that would help me.
Connect with us for free demo today!
Ksolves is 24/7 open to discuss your thoughts and queries!
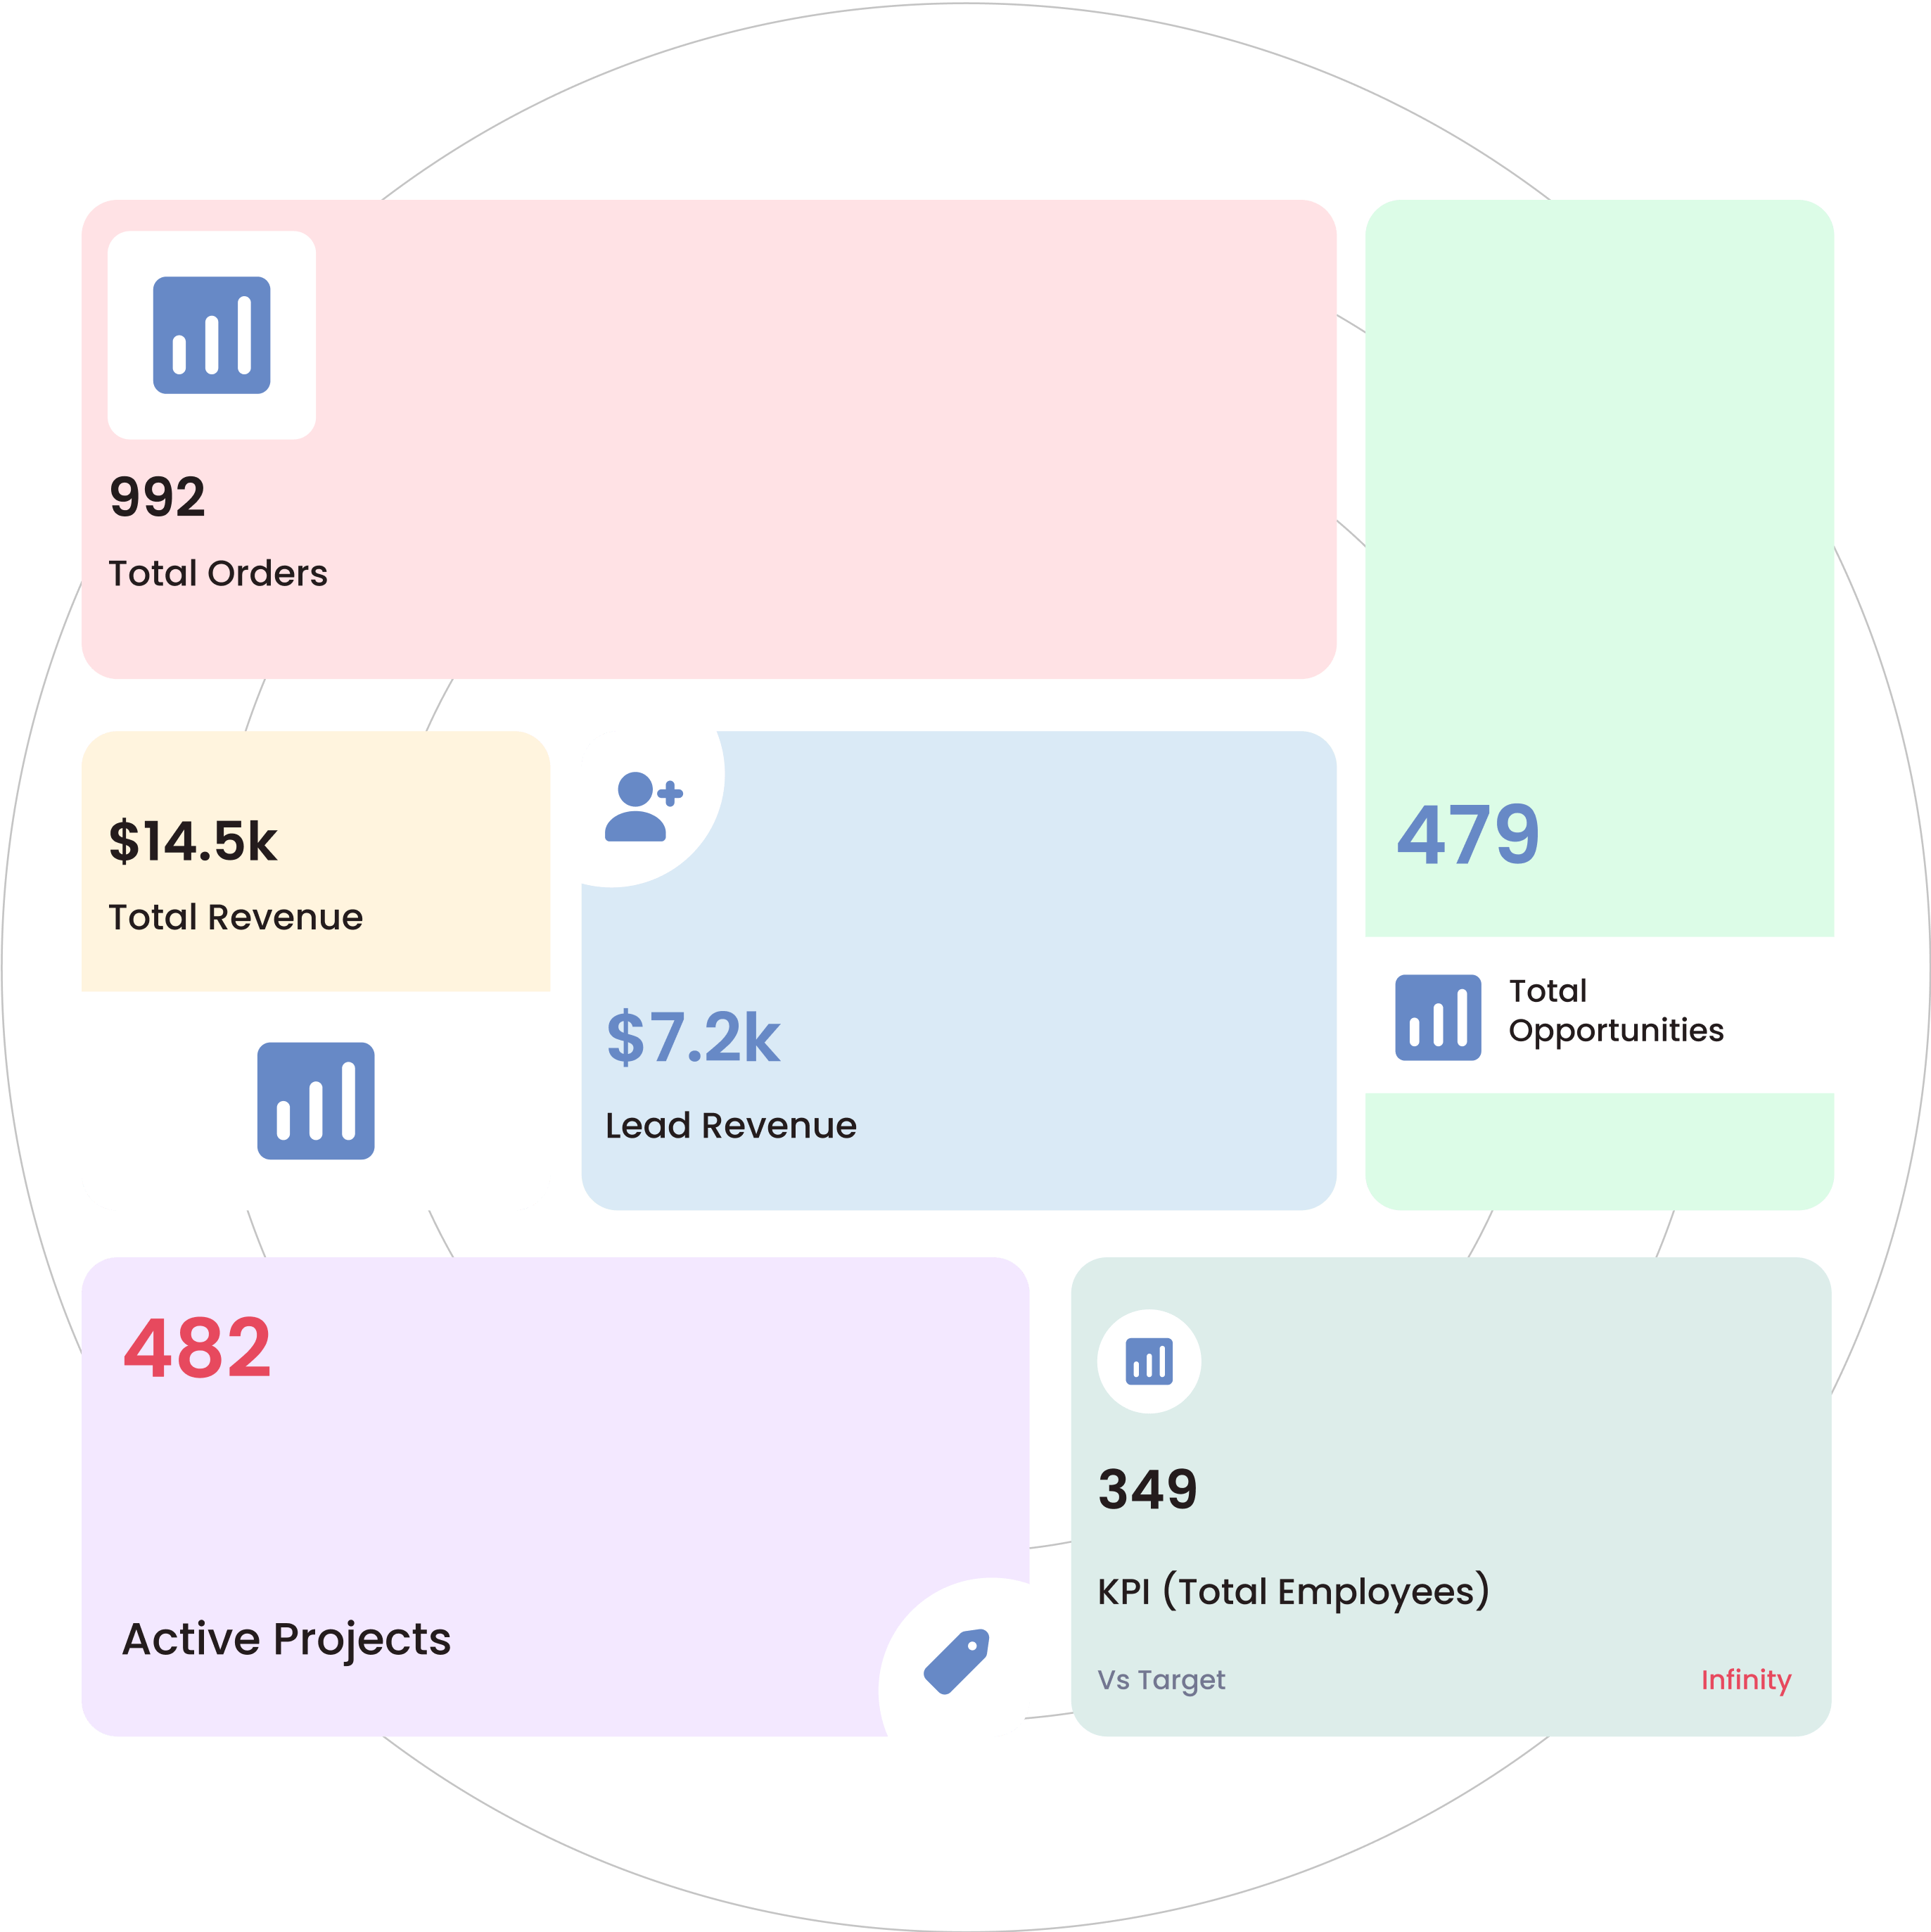
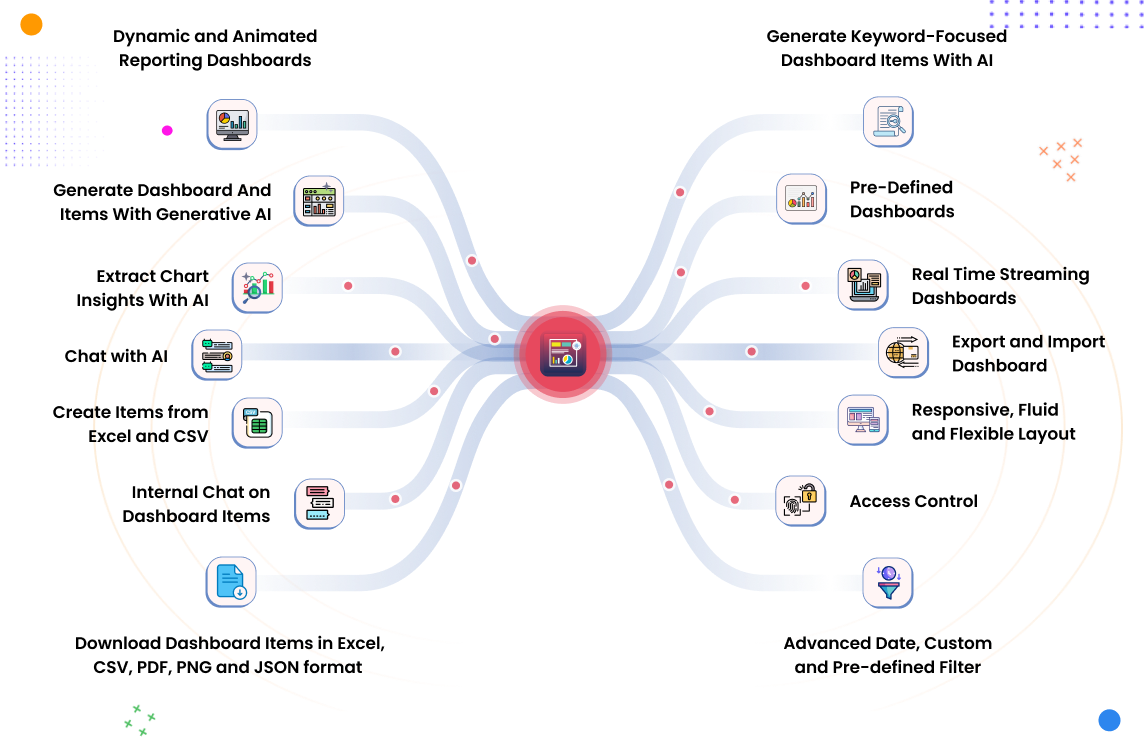
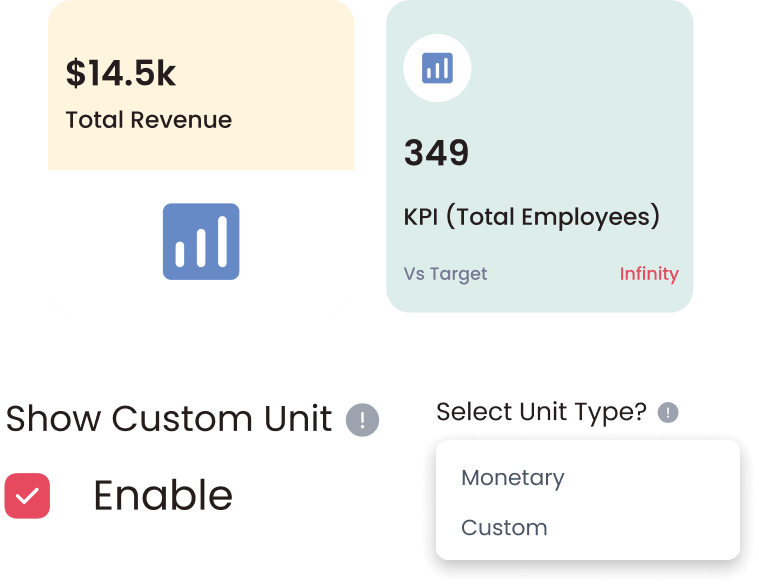
Dashboard Ninja Features
Explore intuitive features that empower you to turn your Odoo data into actionable insights. Track key performance indicators and make informed, data-driven decisions.
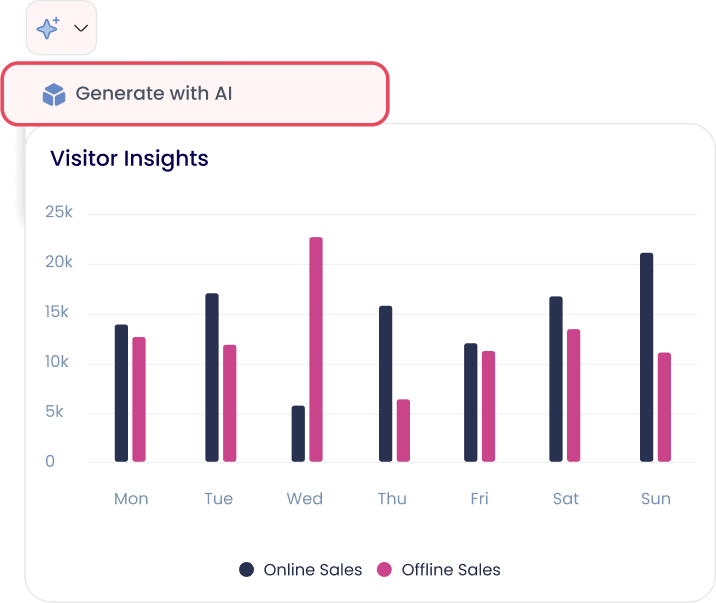
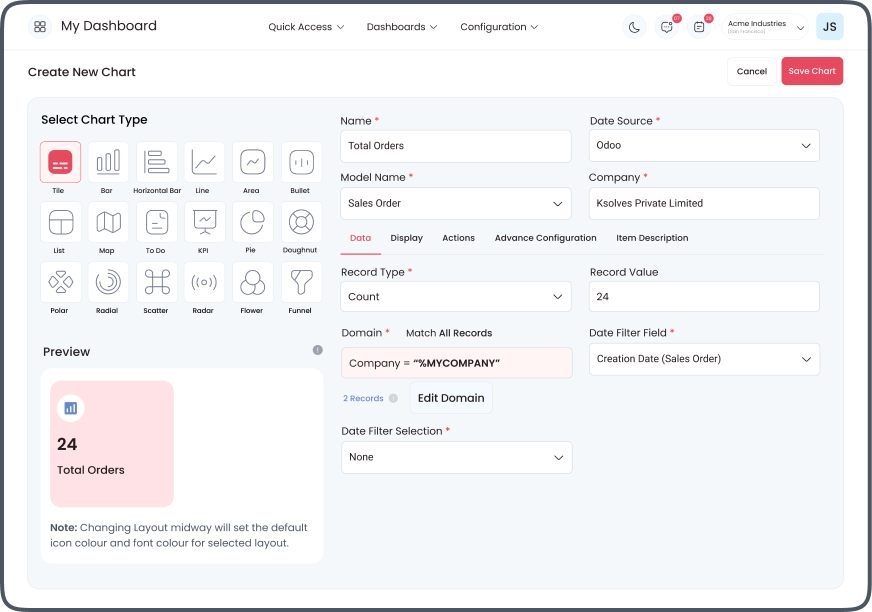
Generate Items with AI
Generate multiple items for your Odoo Dashboard with AI.
Gain the flexibility to
choose from a range of charts and graphs and save them
with ease.
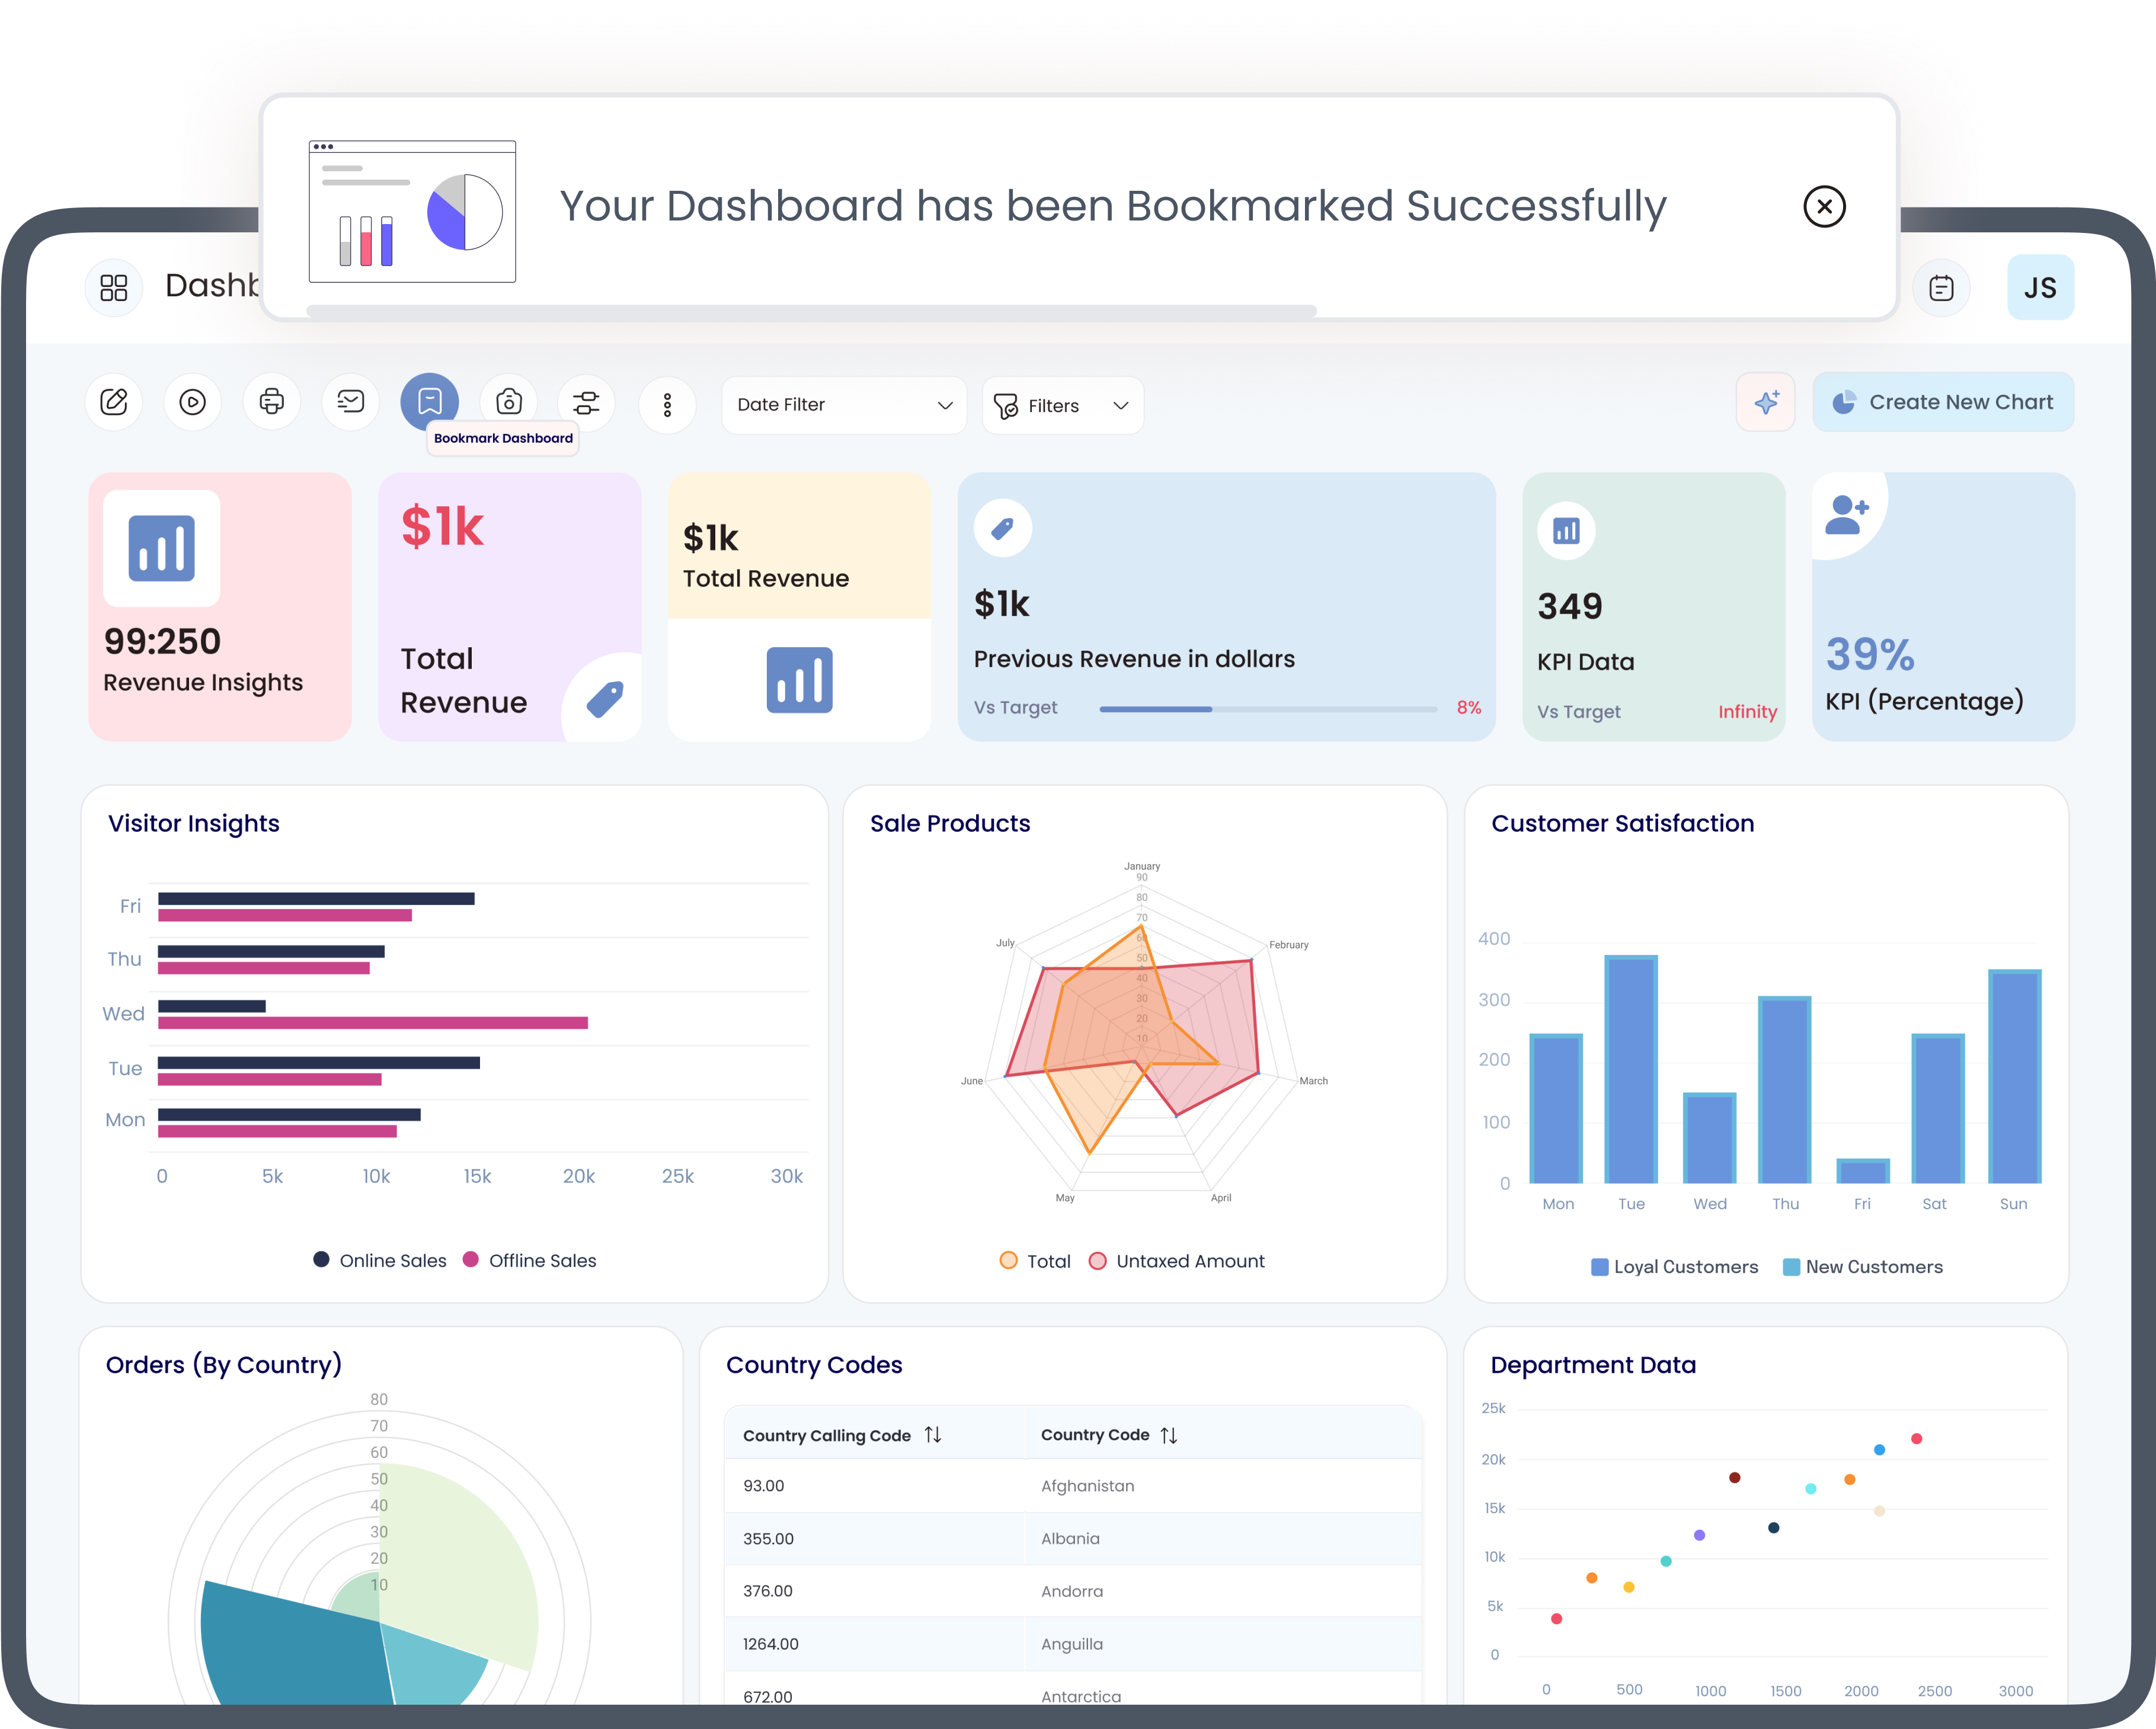
Bookmark Dashboard
Bookmark your key dashboards and easily access them for faster data analysis. Effortlessly remove dashboards from the bookmark when you are done with them.
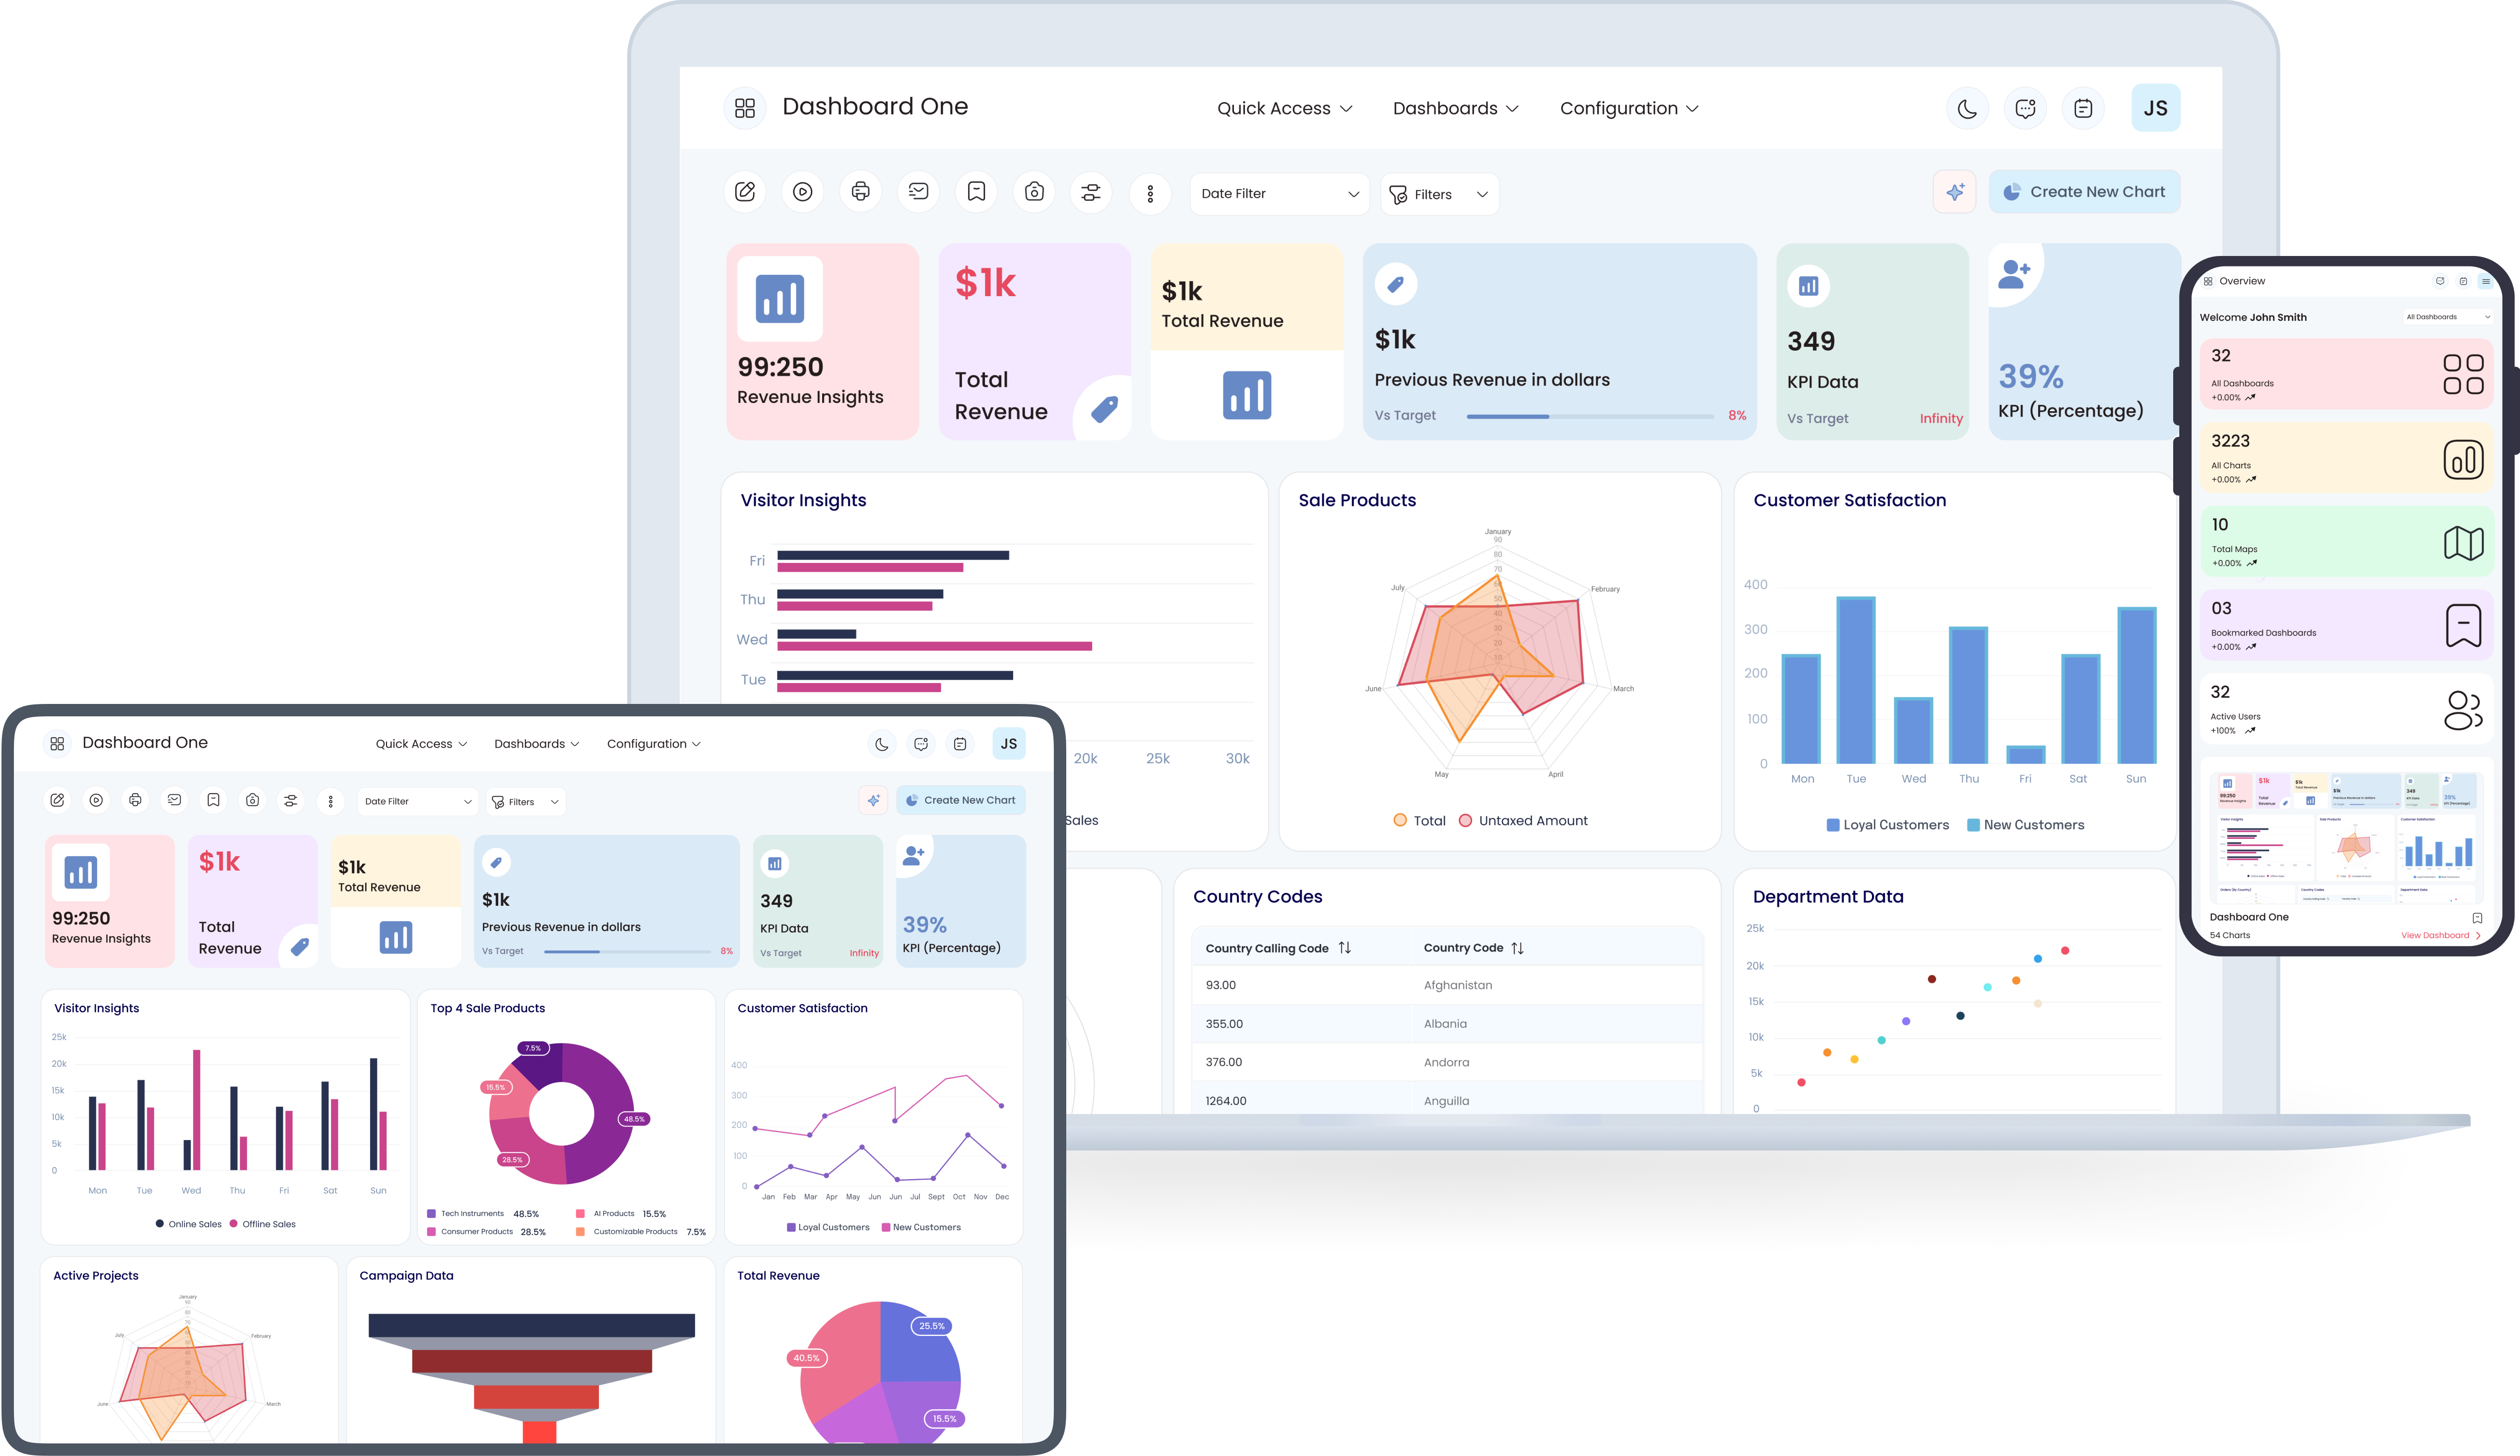
Responsive Fluid & Flexible Layout
Conveniently view your data over different devices such as Mobile, Desktop, or Tablet for easy access. It offers an optimized browsing experience to track business performance on the go.
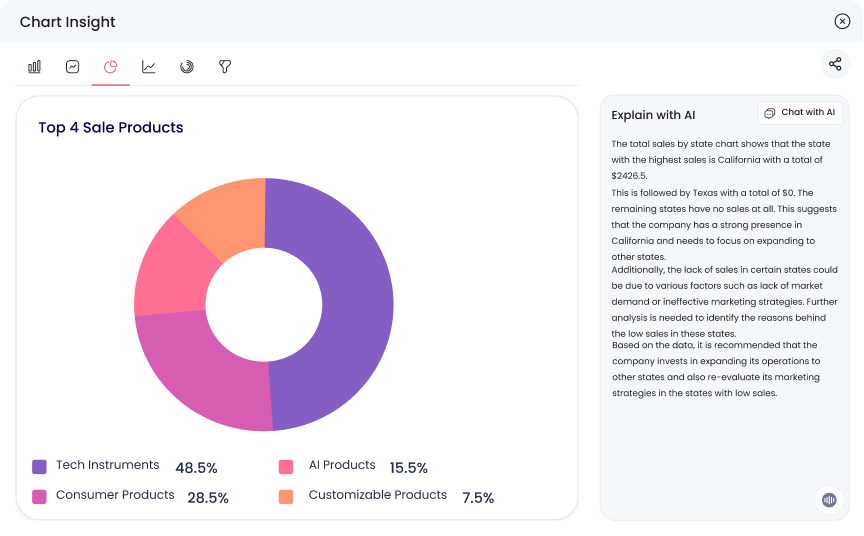
Extract Chart Insights With AI
Interpret complex charts with single-click AI-generated explanations! Identify hidden patterns & trends and make informed data-backed business decisions.
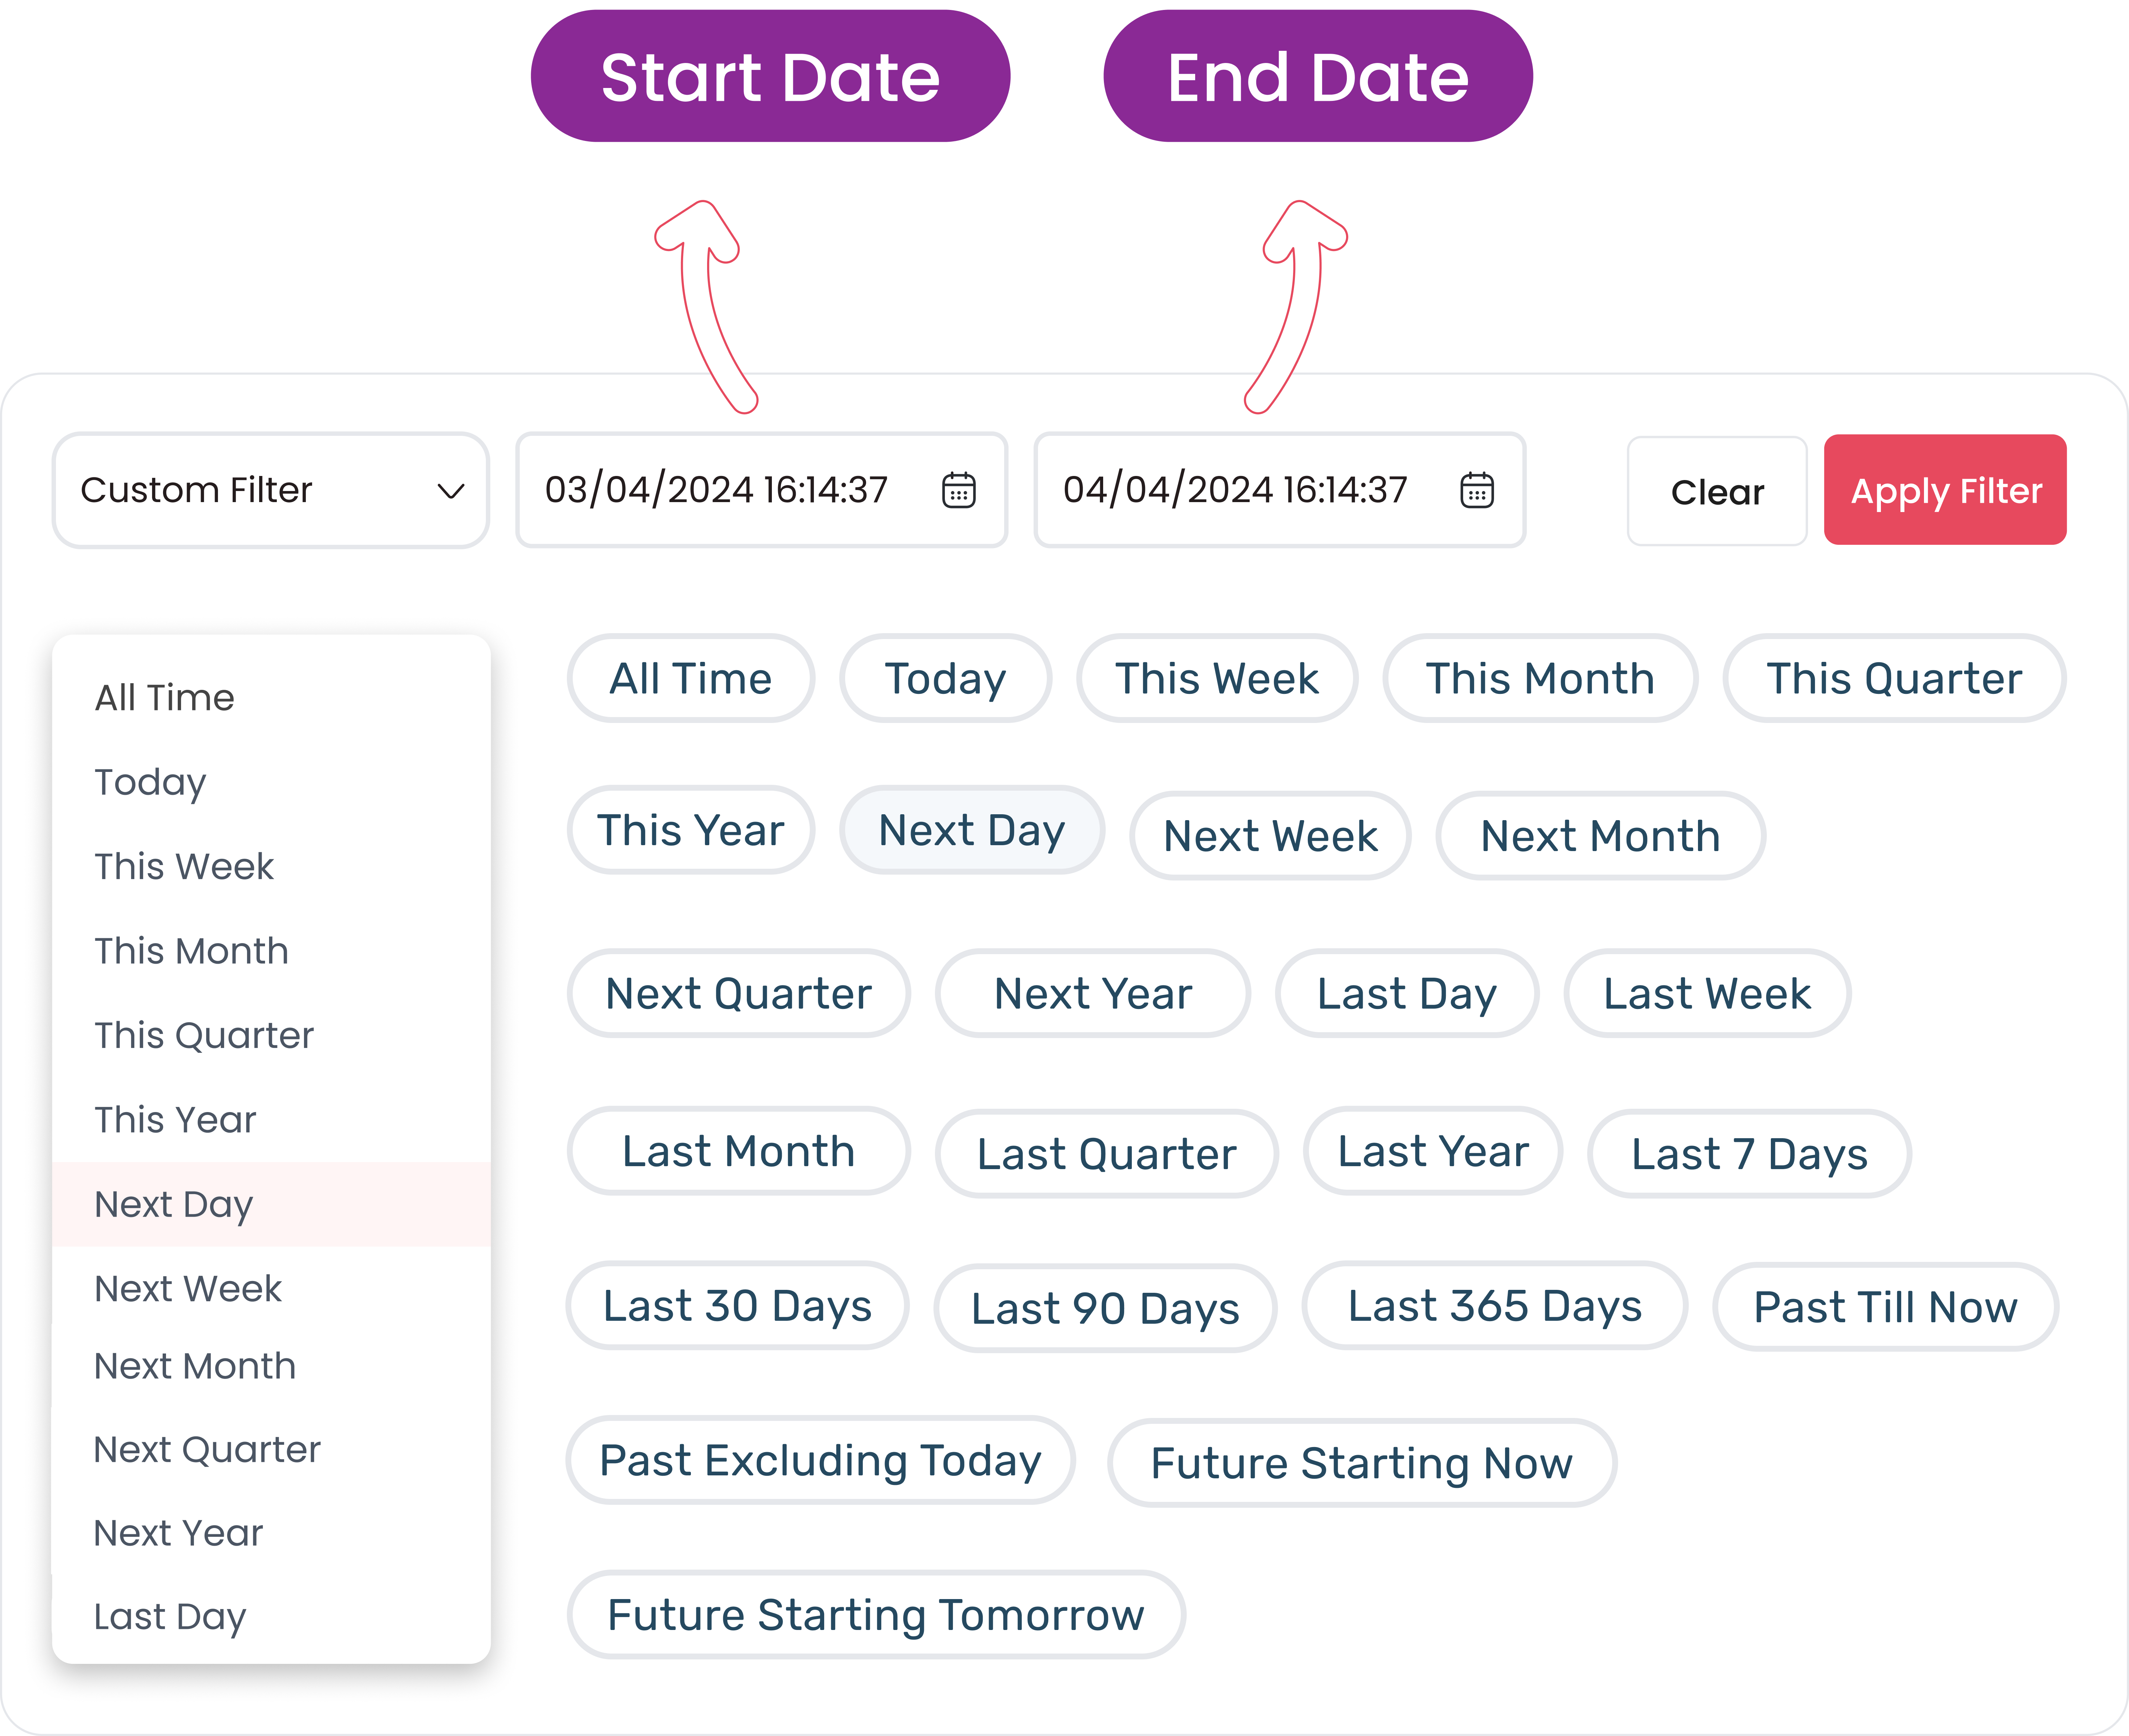
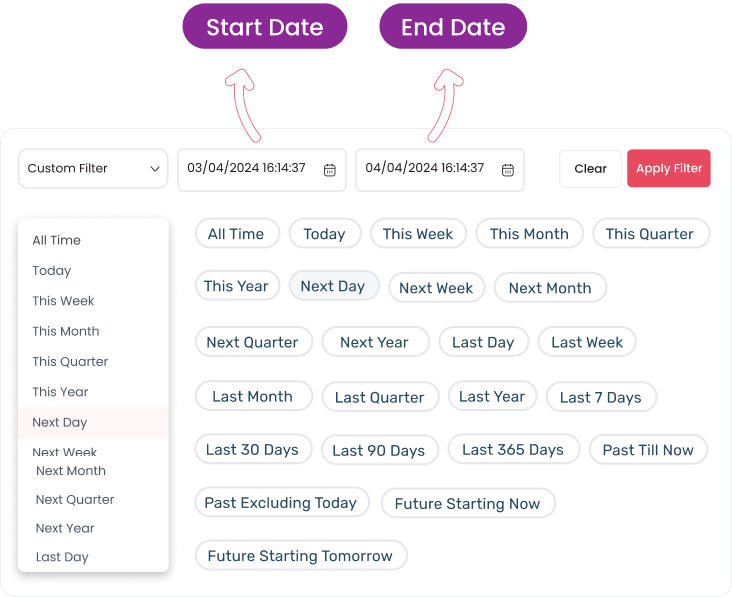
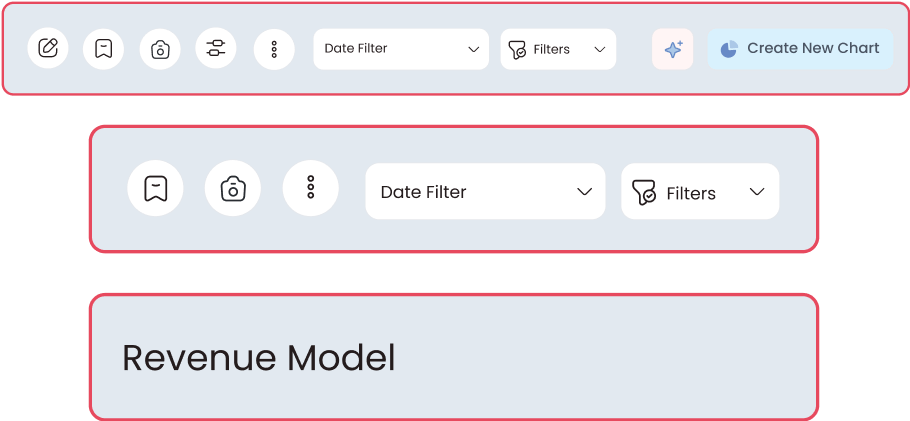
Advanced Date Filter
Present data in a timely manner over a selected period in the date filter option. Select from 20 predefined date filters (Last 7 days, Last 30 days, Last 90 days, & more) or choose a custom date.
Internal Chat
Collaborate with your team members with the chat feature on every item of a dashboard. A dedicated channel is created for conversations on each item, and all channels are organized in a unified inbox.
Switch Layout
Switch from one graph style to another with just a single click, retaining the same data. Effortlessly analyze your data with the desired data visualization chart!
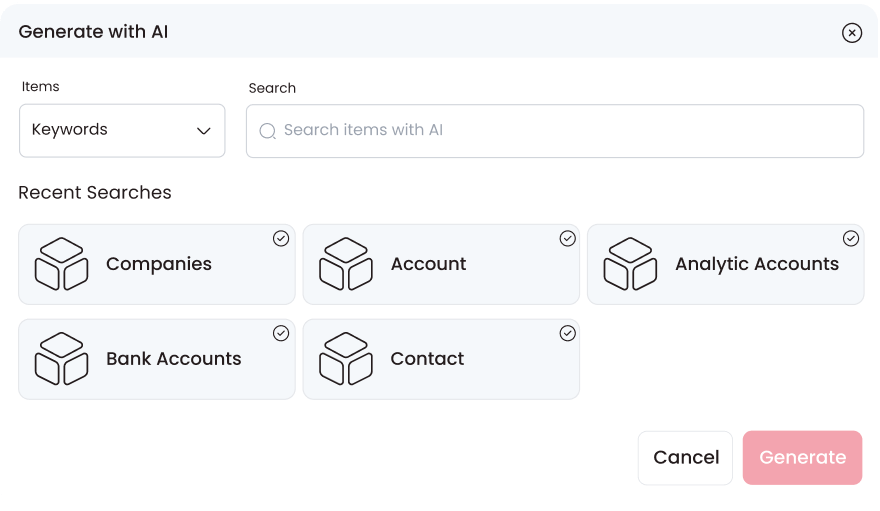
Generate keyword-focused Odoo Dashboard Items with AI
Now just provide the keyword, and AI will create the dashboard items for you within seconds.
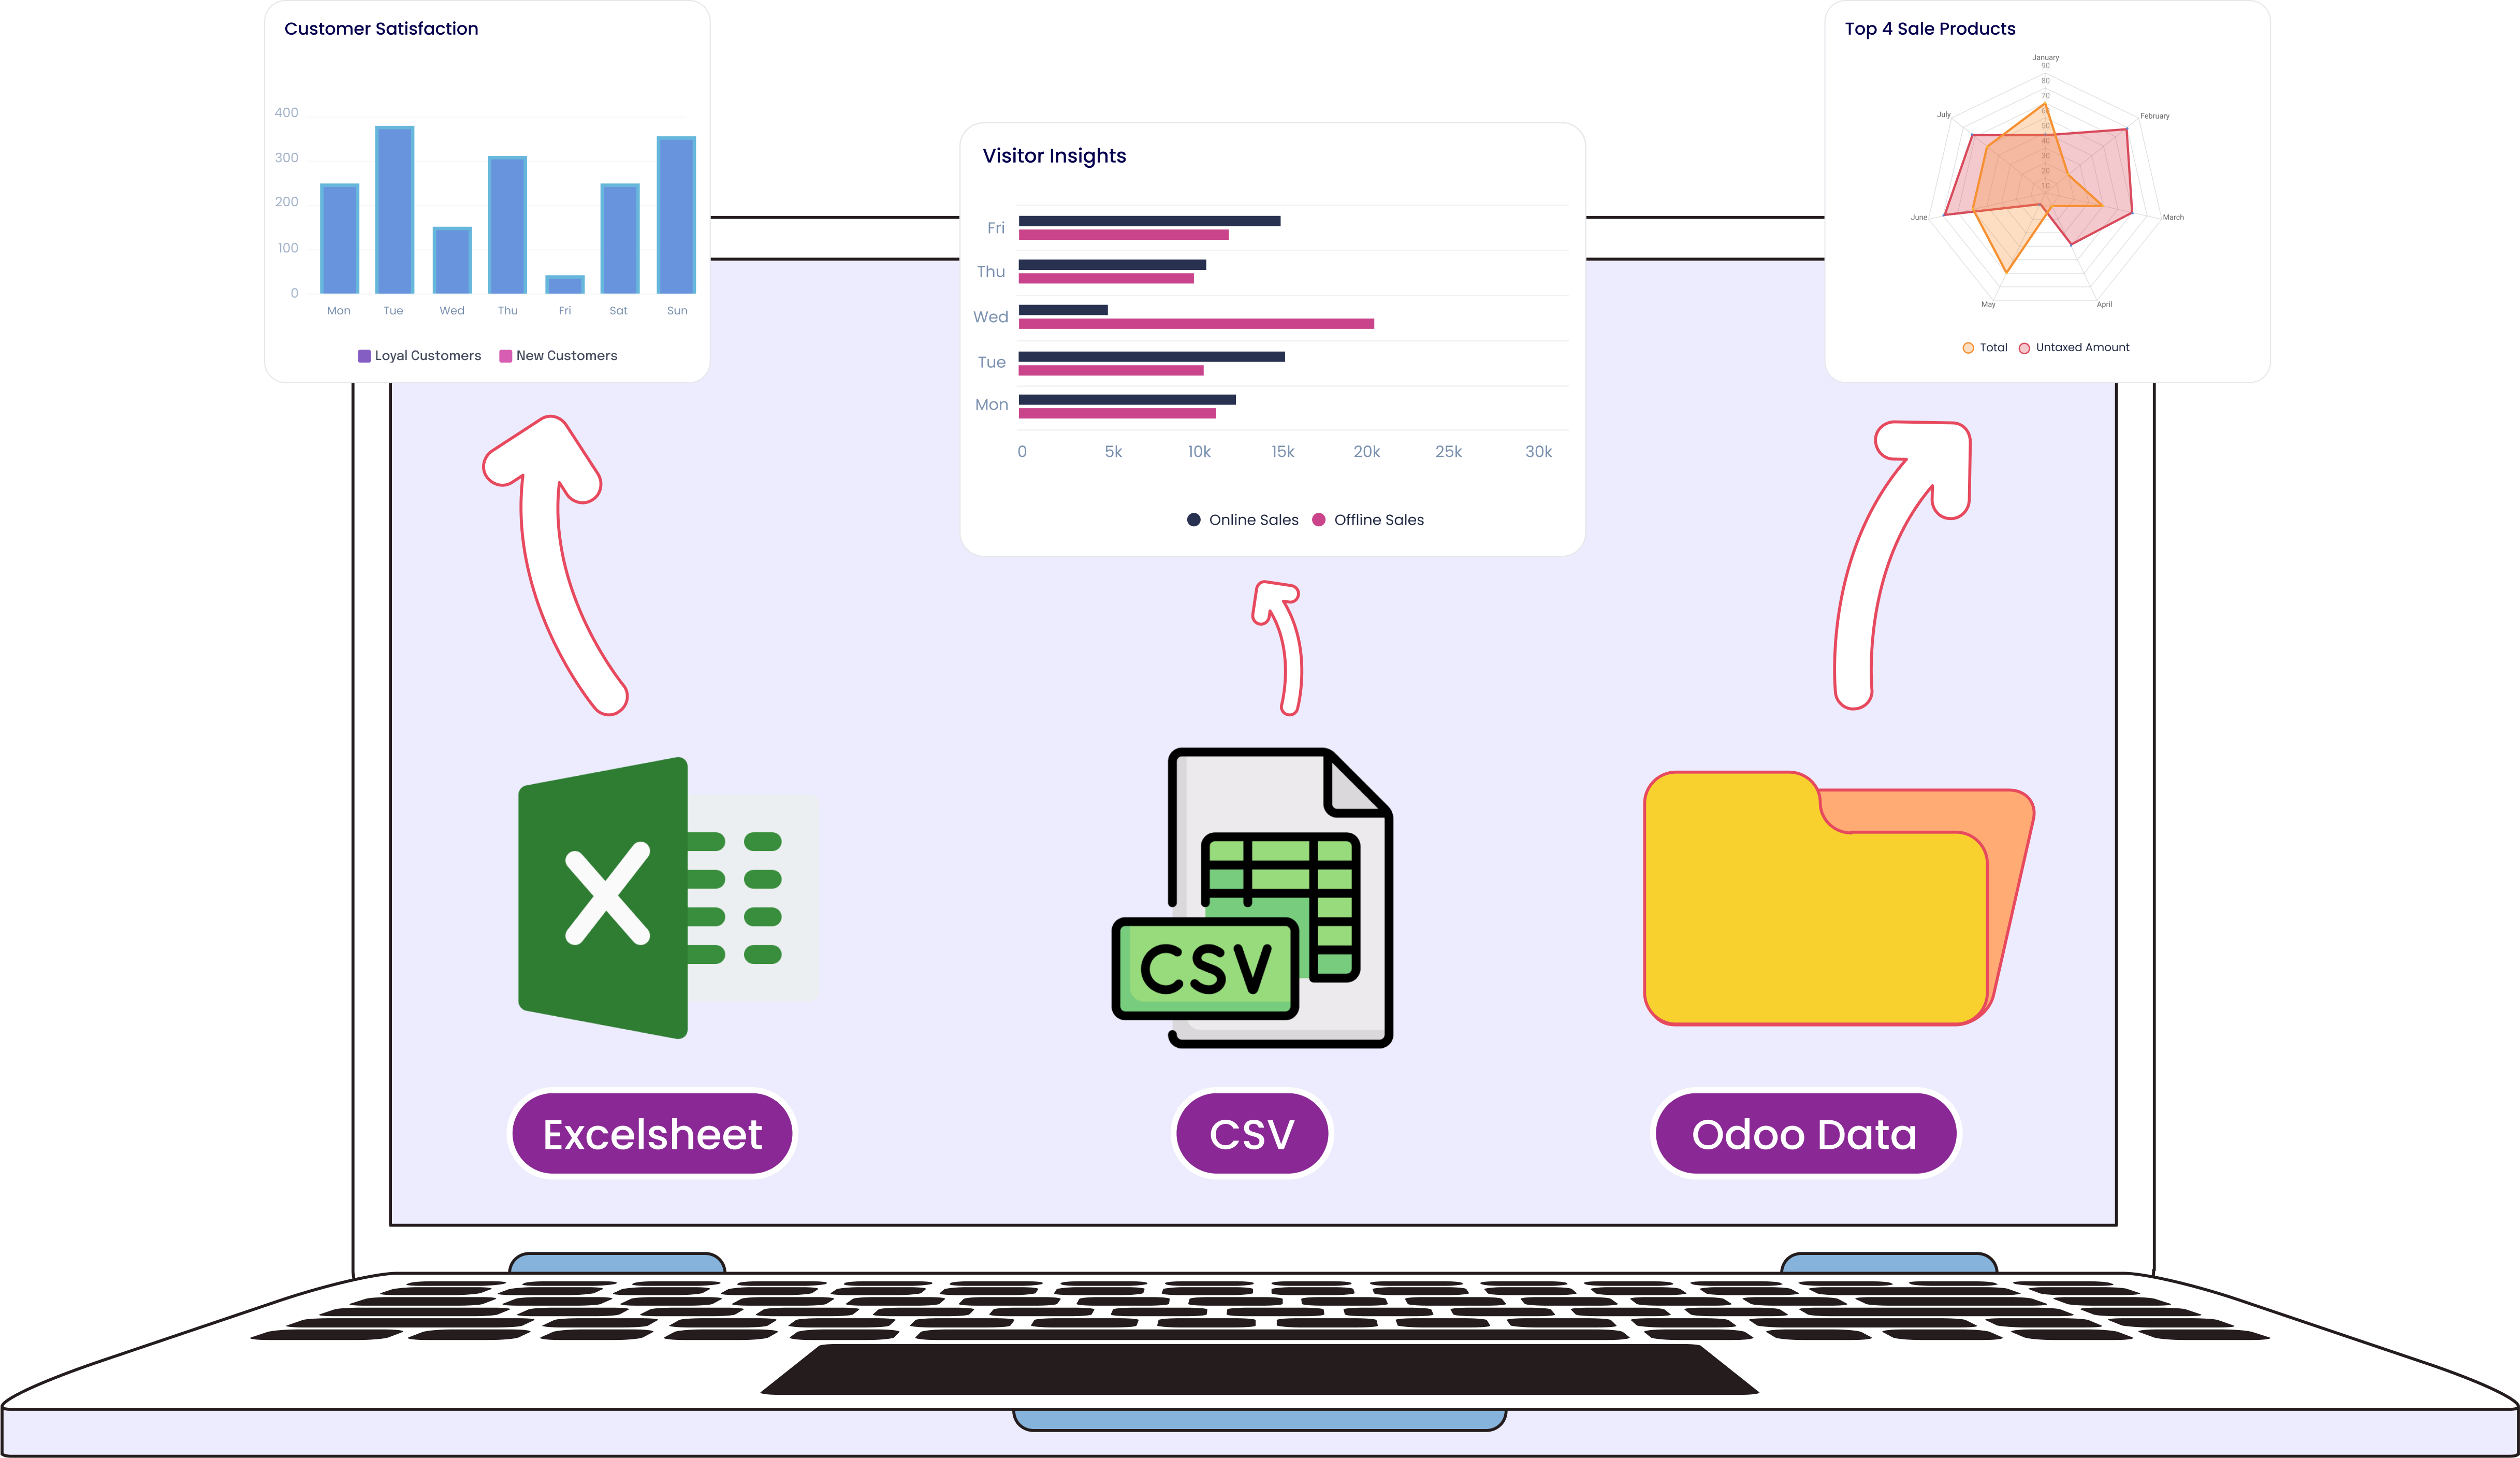
Create charts From Excel & Csv Files
Easily upload Excel or CSV files, and let the system automatically synchronize the data. It will then process the data and create charts.
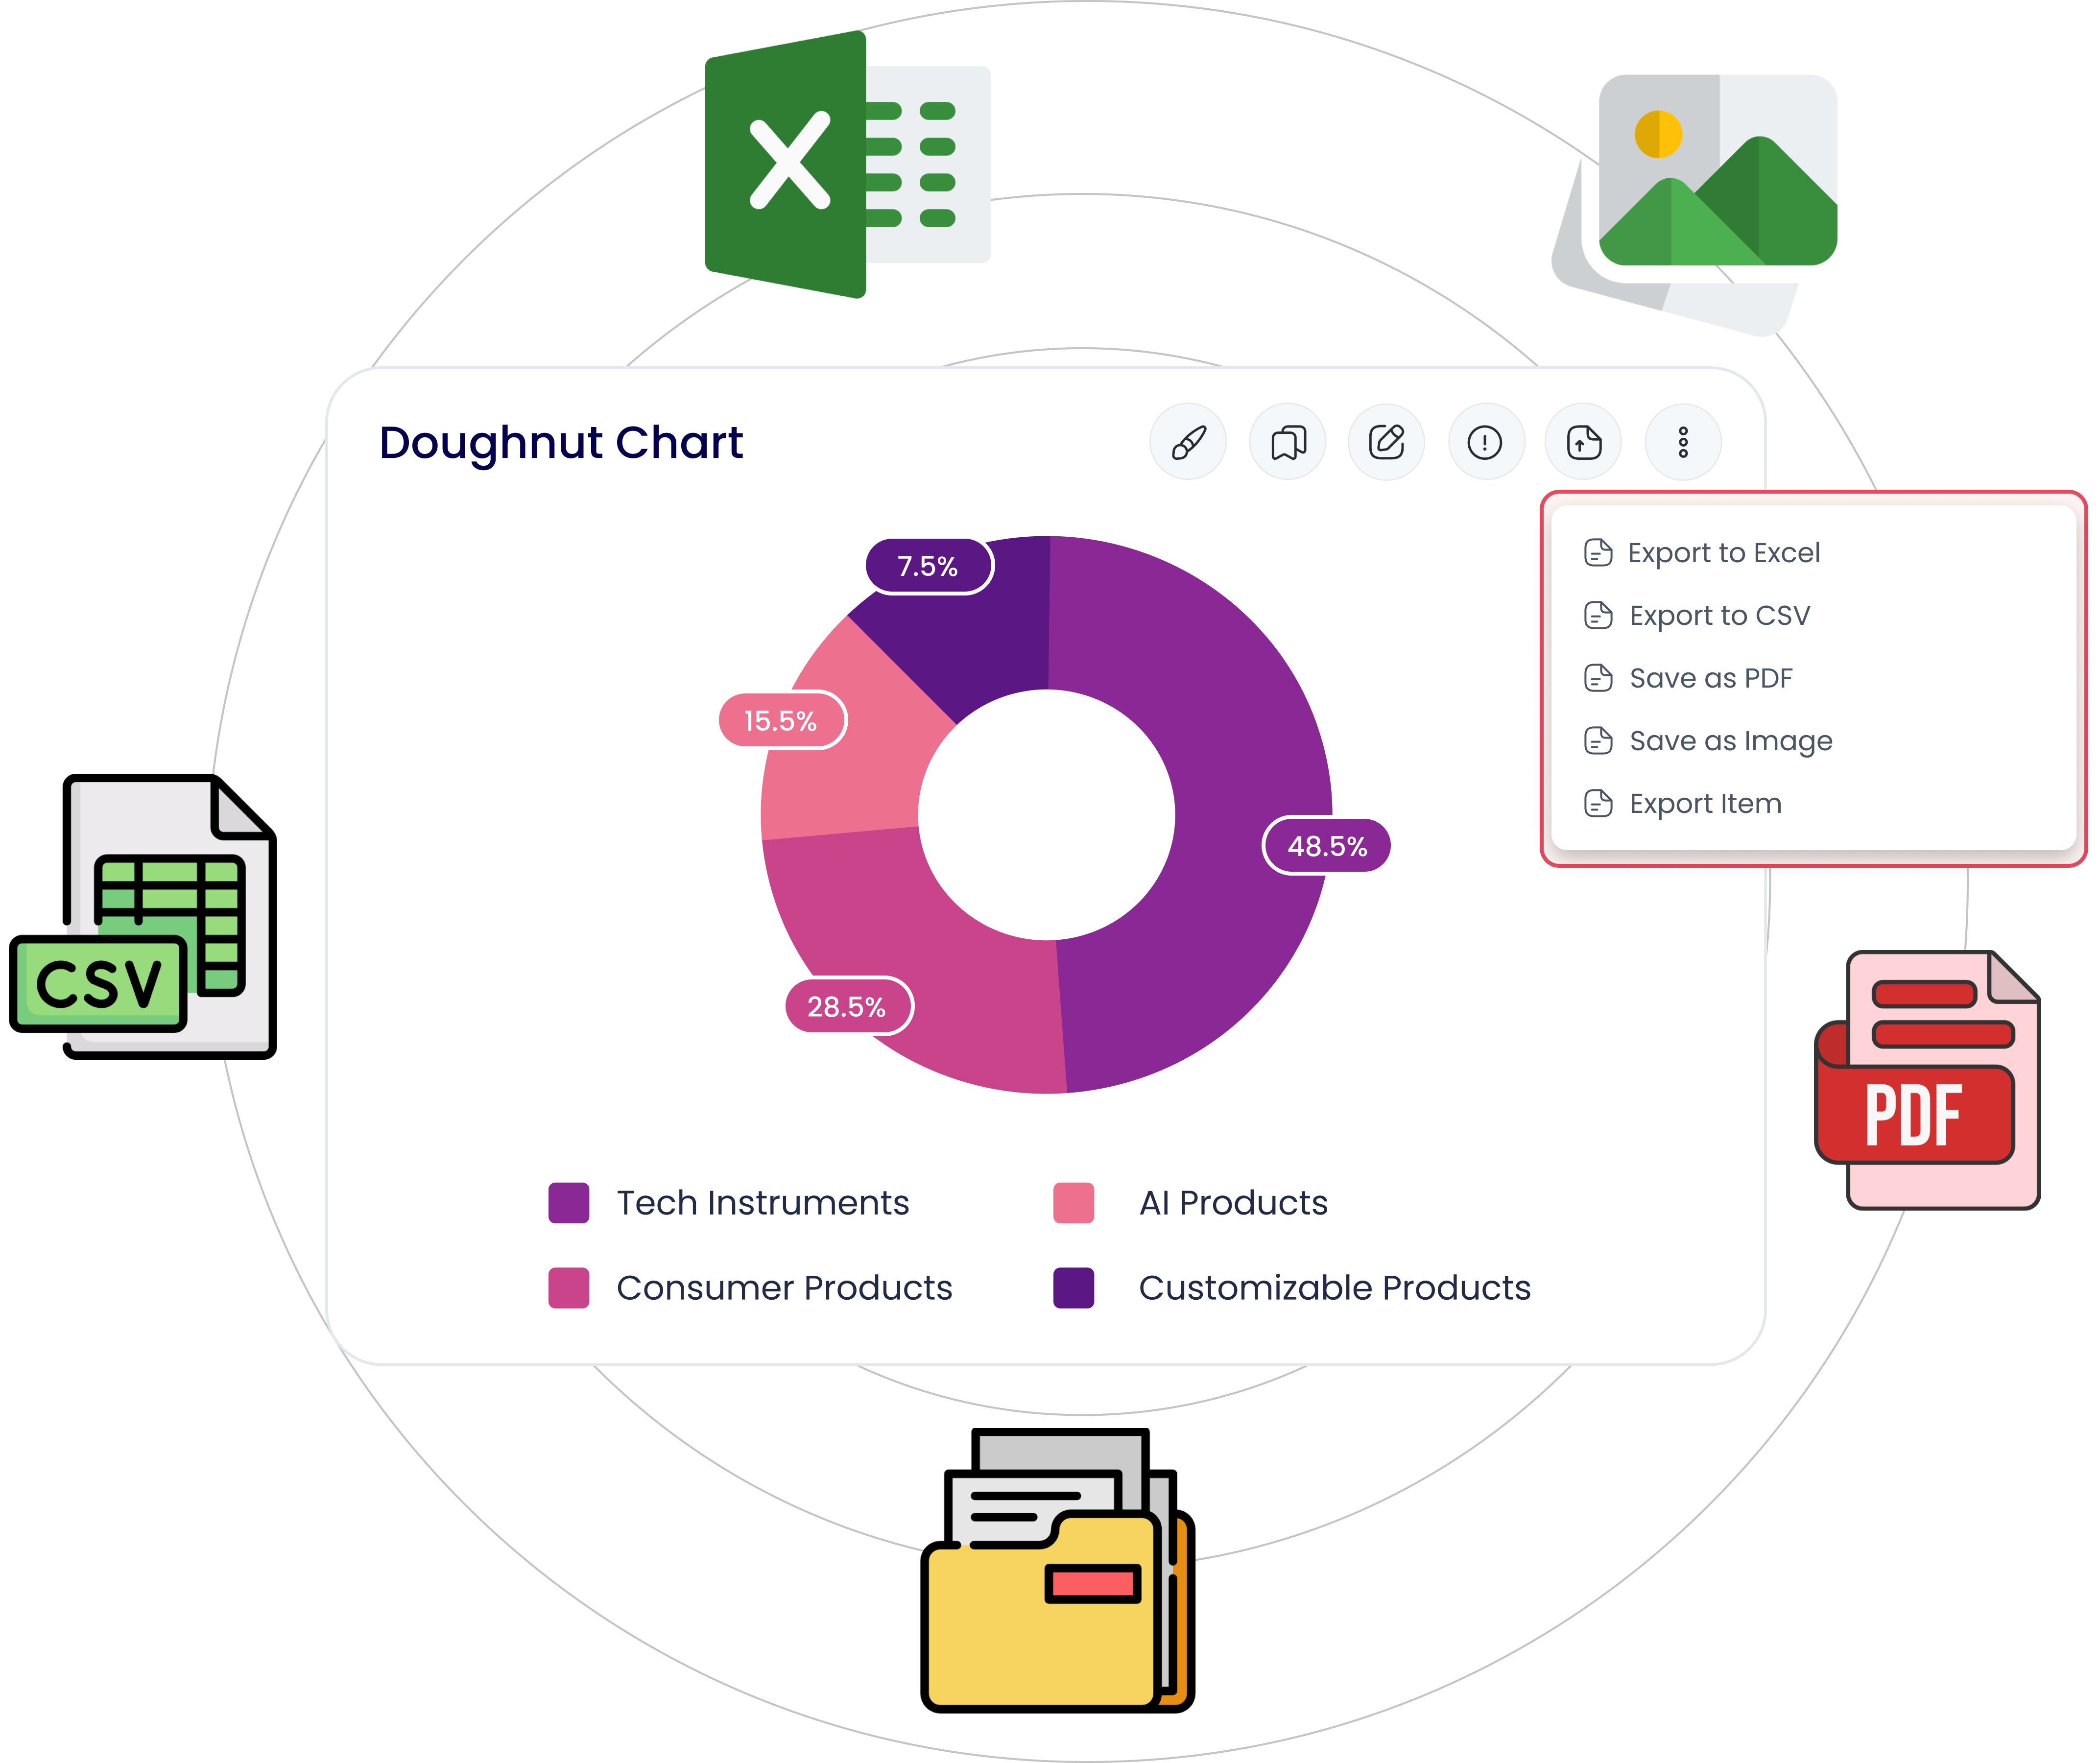
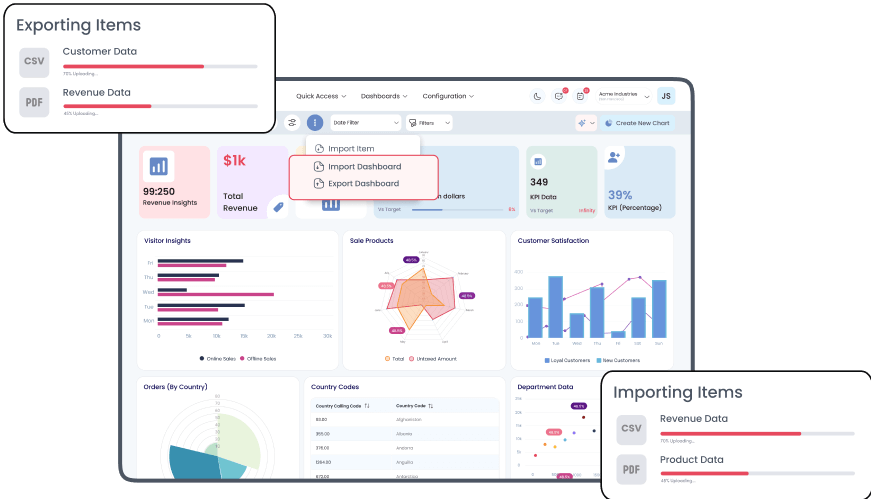
Download Odoo Dashboard Items (Excel, CSV, PDF, PNG)
Exported data items can be used for offline presentations, seminars, or emails.
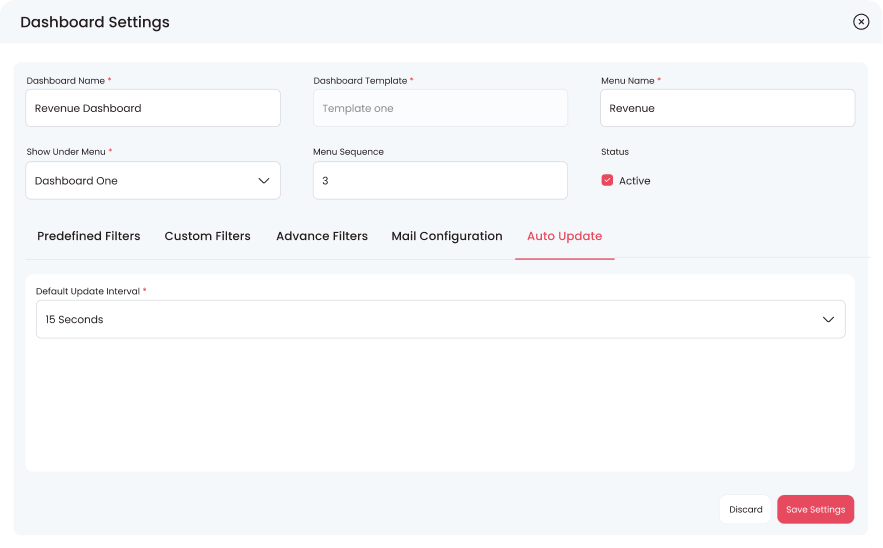
Real-Time Streaming
Dashboard
Upgrades the data in real-time to give a 360 view of the business performance. This feature will update the data if any changes occur from the backend in real-time or after a specific interval of time.
Drill Down / Drill Up Data
Modify the degree of details presented in a dashboard entity. Drill-down to access detailed data or drill-up to get a broader view of information.
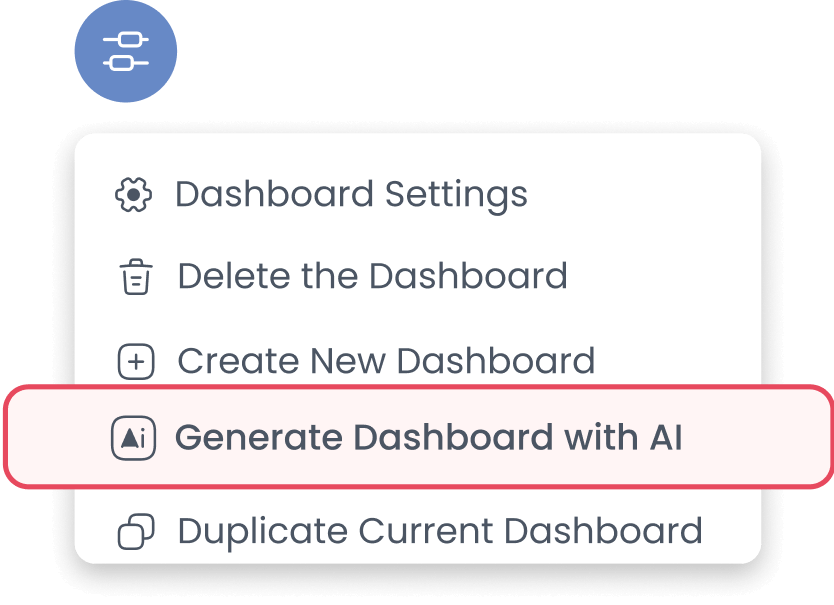
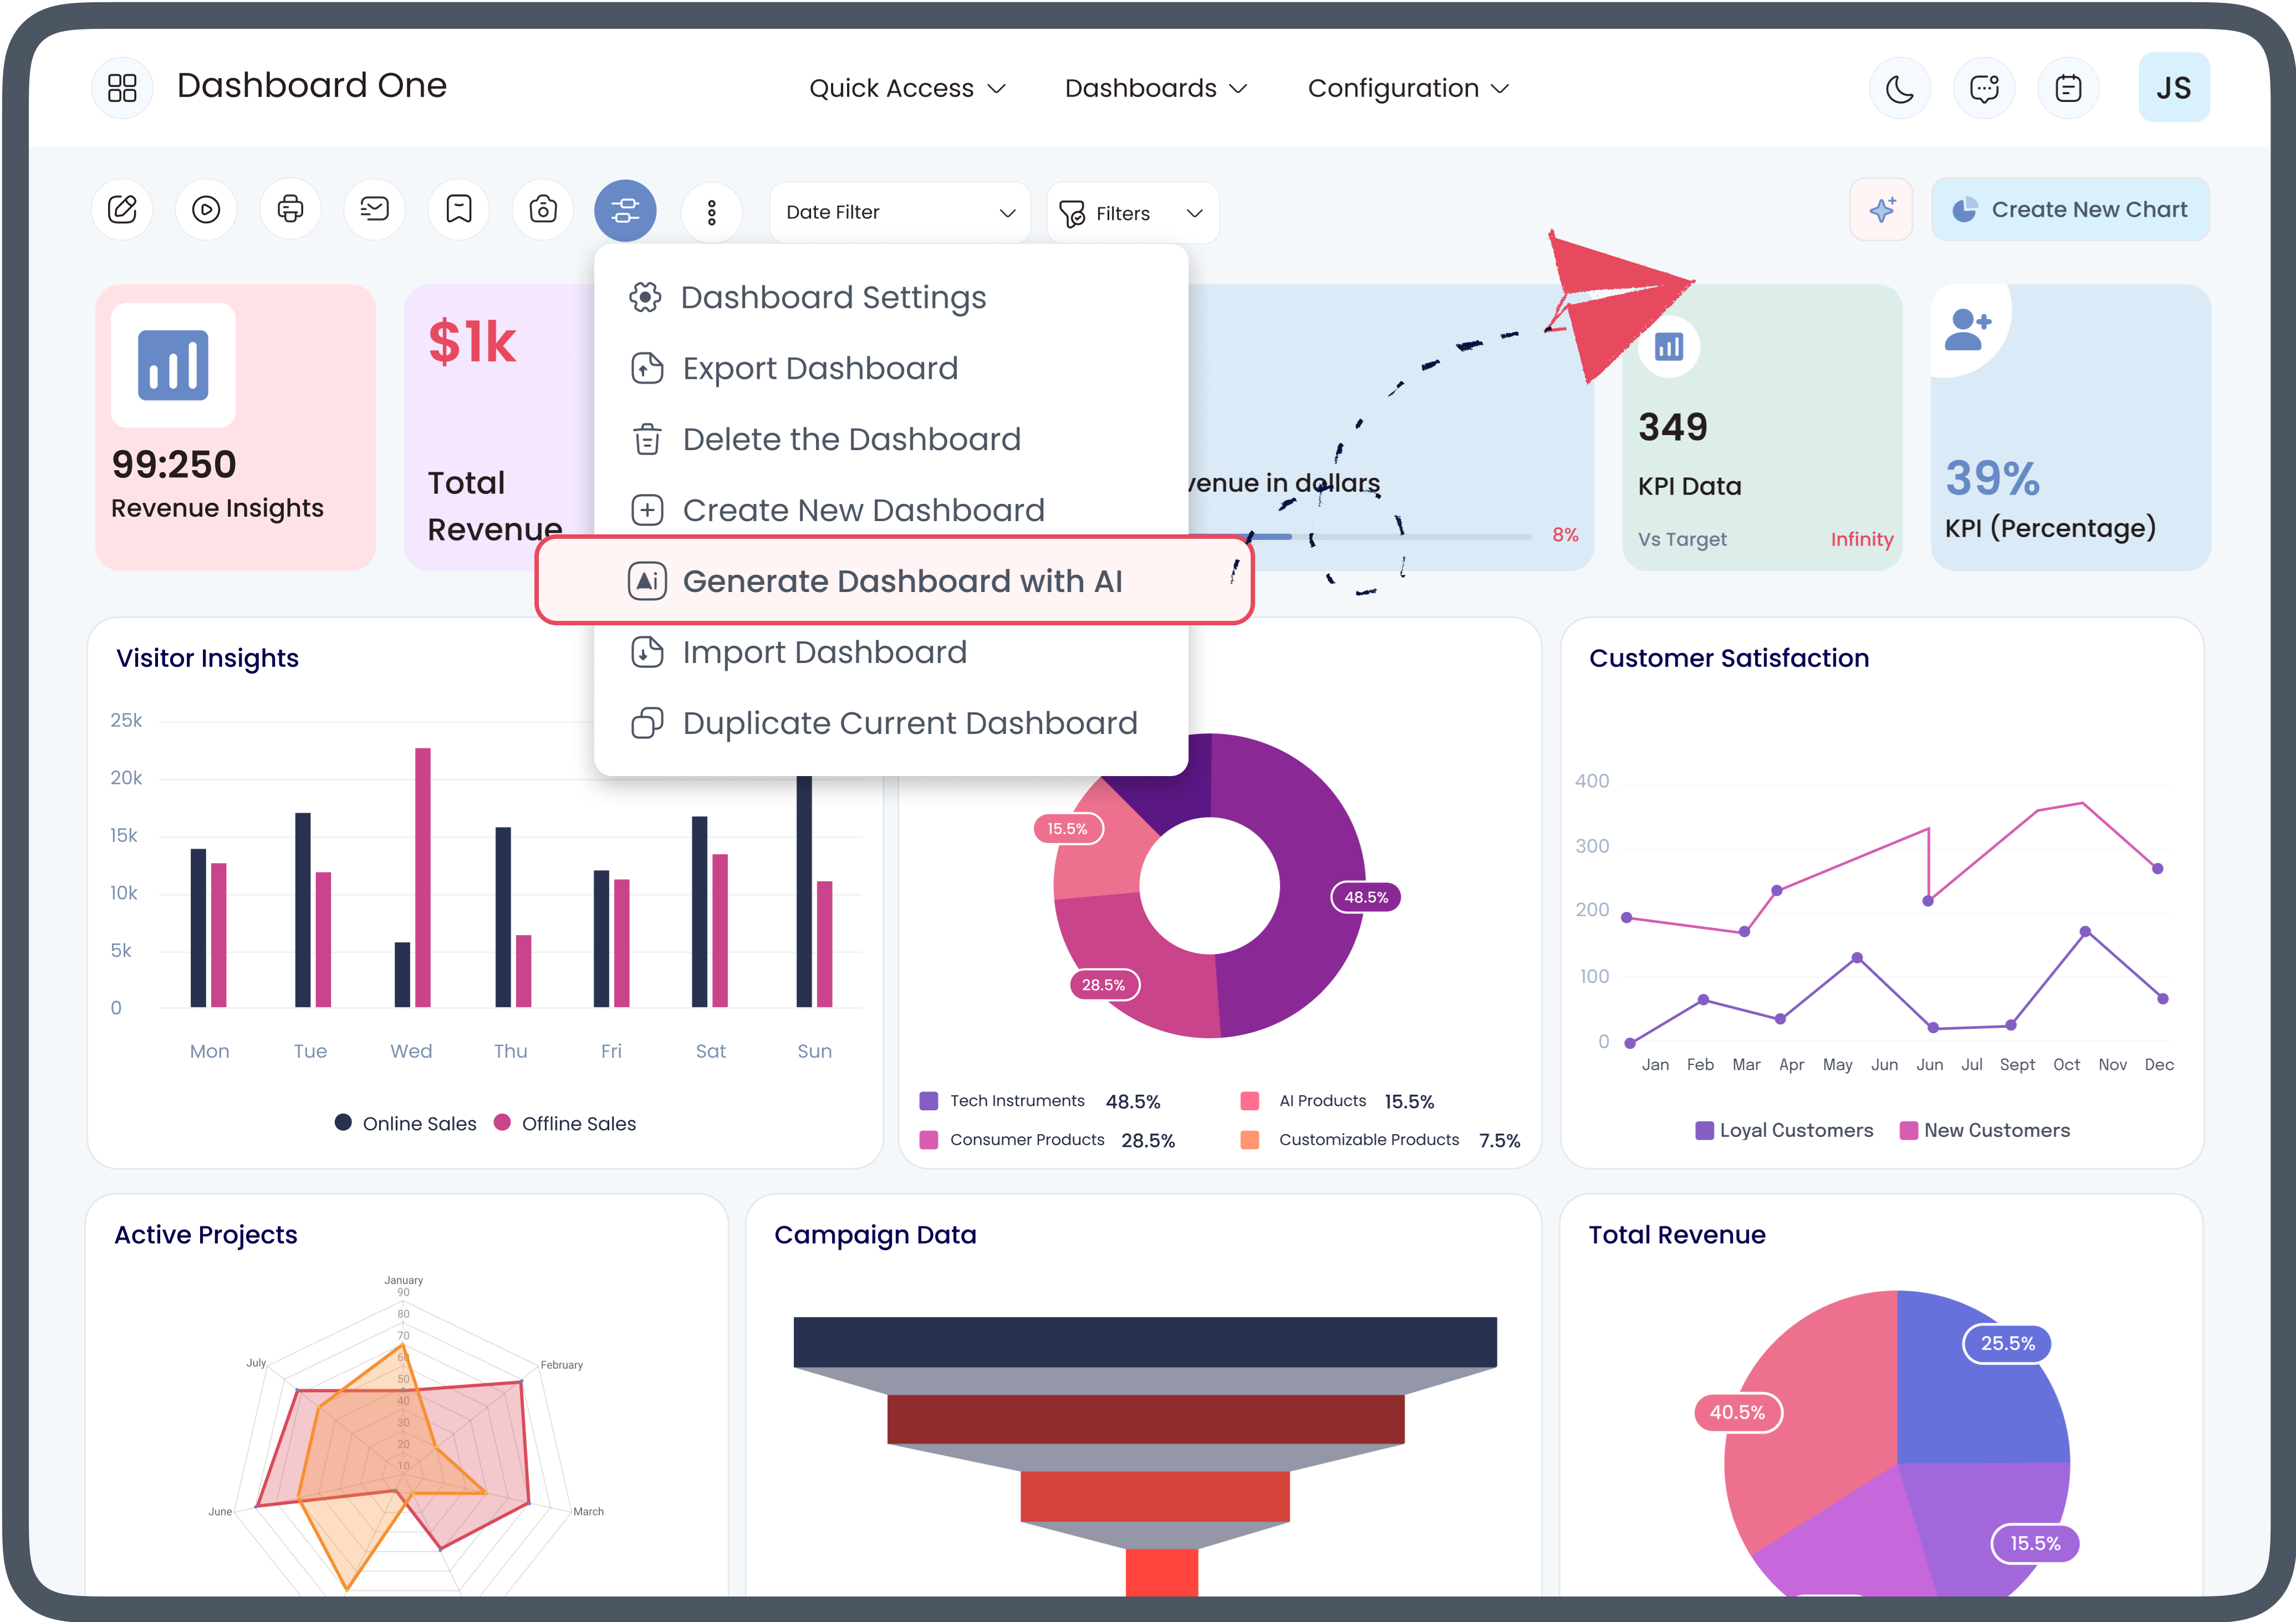
Generate Complete Odoo Dashboard with AI
Save your time and effort! Generate a complete Odoo
Dashboard
a specific model within a few clicks with AI efficiency.
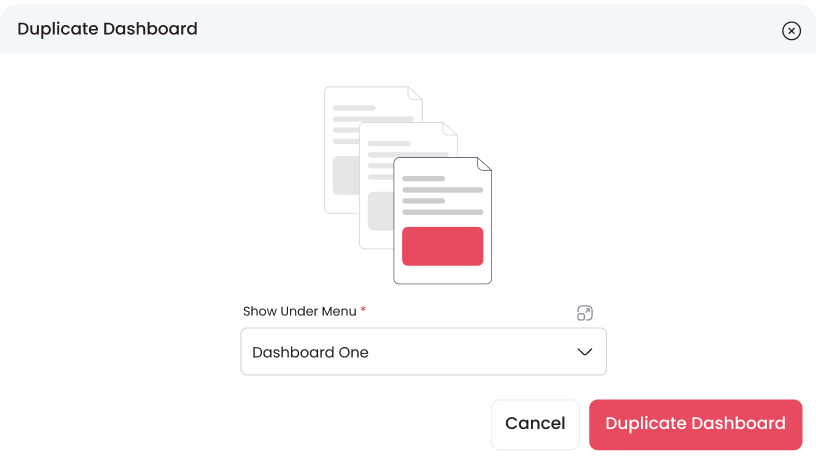
Export & Import Dashboards or
Specific Odoo Dashboard Items
Export an entire Odoo Dashboard or Specific Odoo Dashboard
Item to a same system or
different Odoo instances for saving time and effort while
migrating from one system to another.

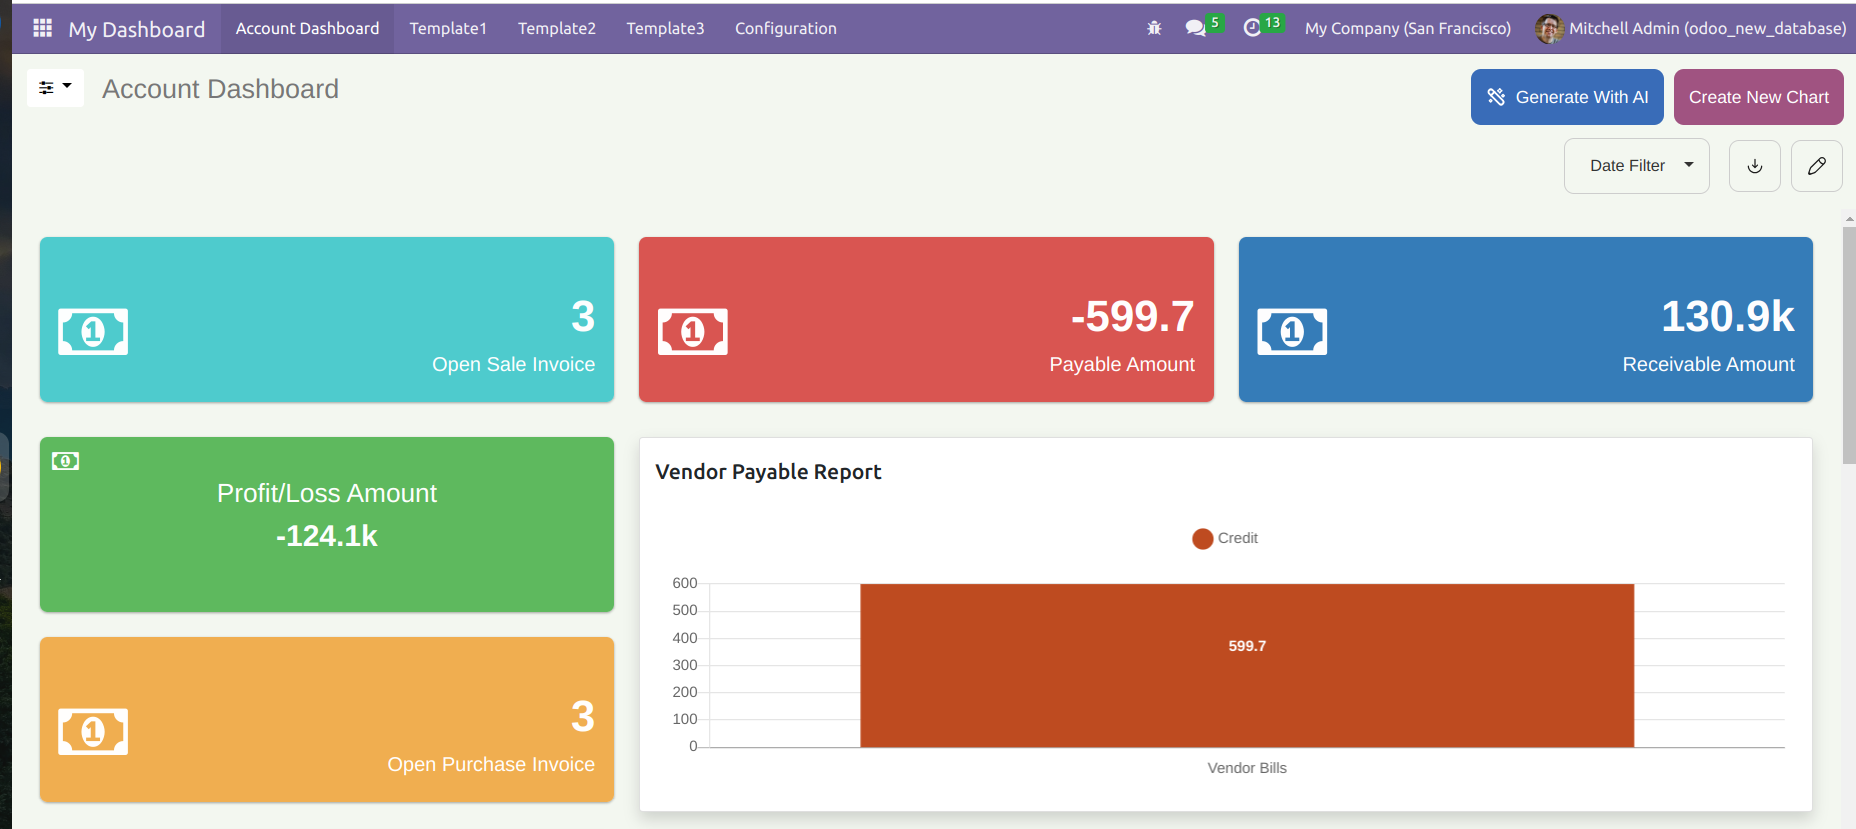
Paid Predefined Dashboards
5 Predefined Odoo dashboards are provided for different
verticals of a
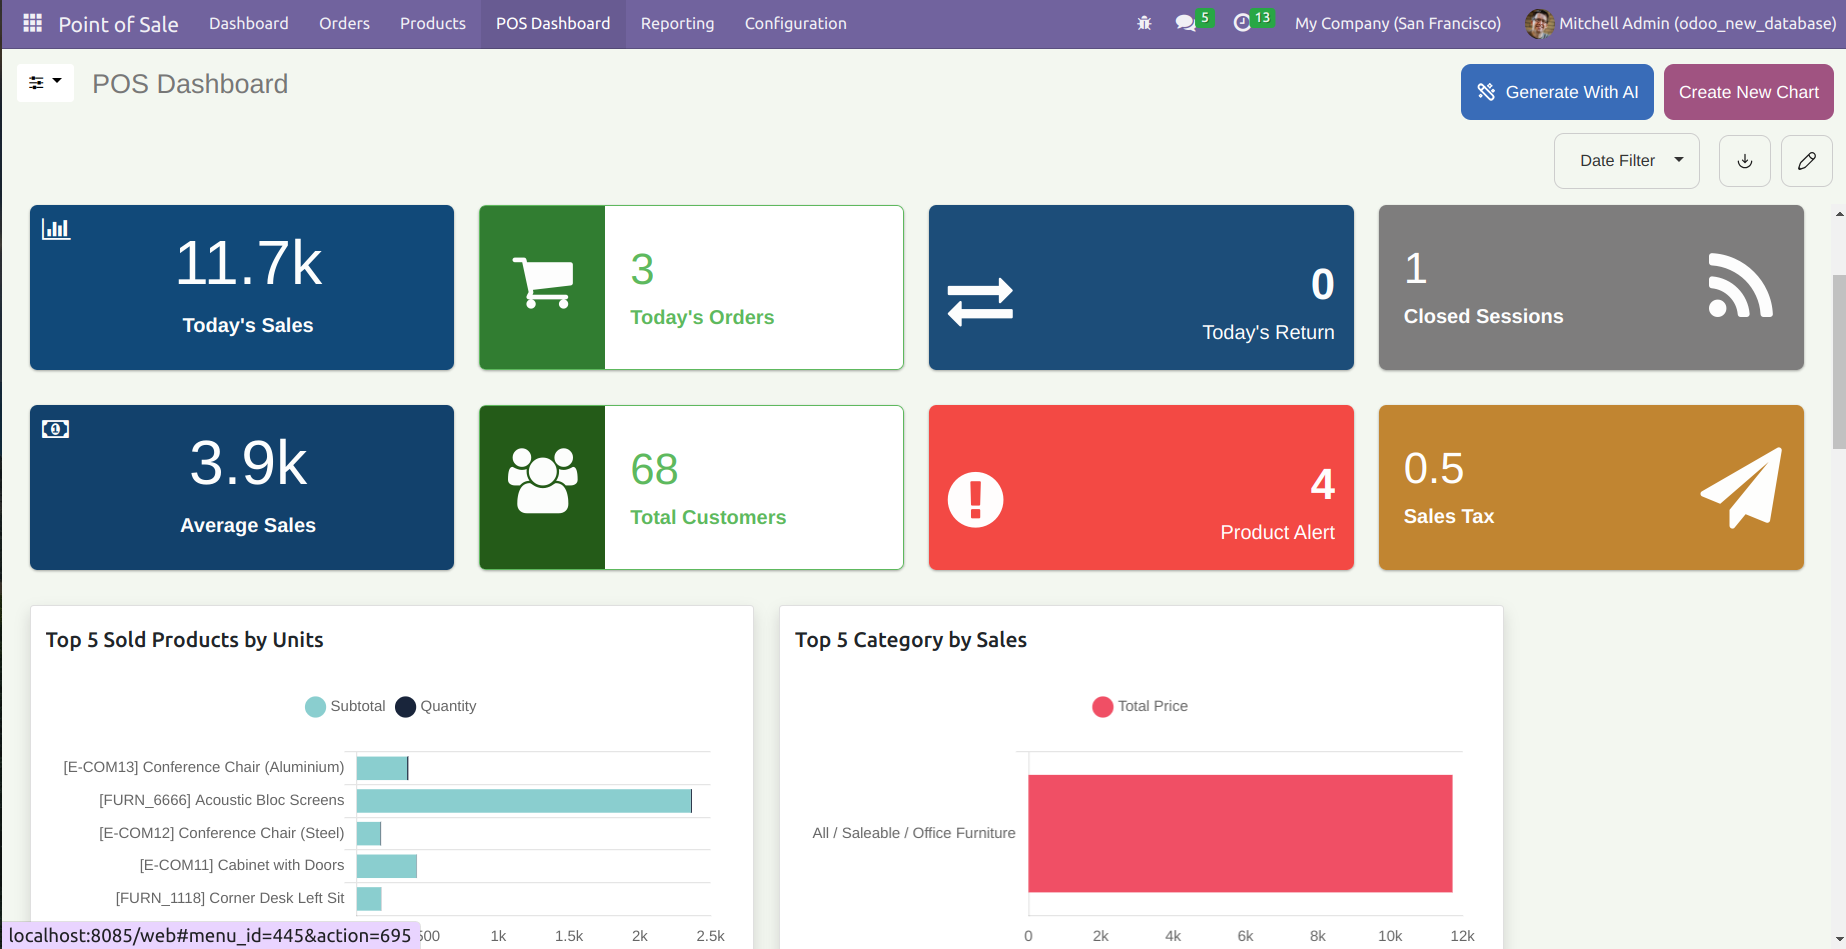
company(Sales, CRM, Account, Inventory, & POS).
Customize them as per your need.
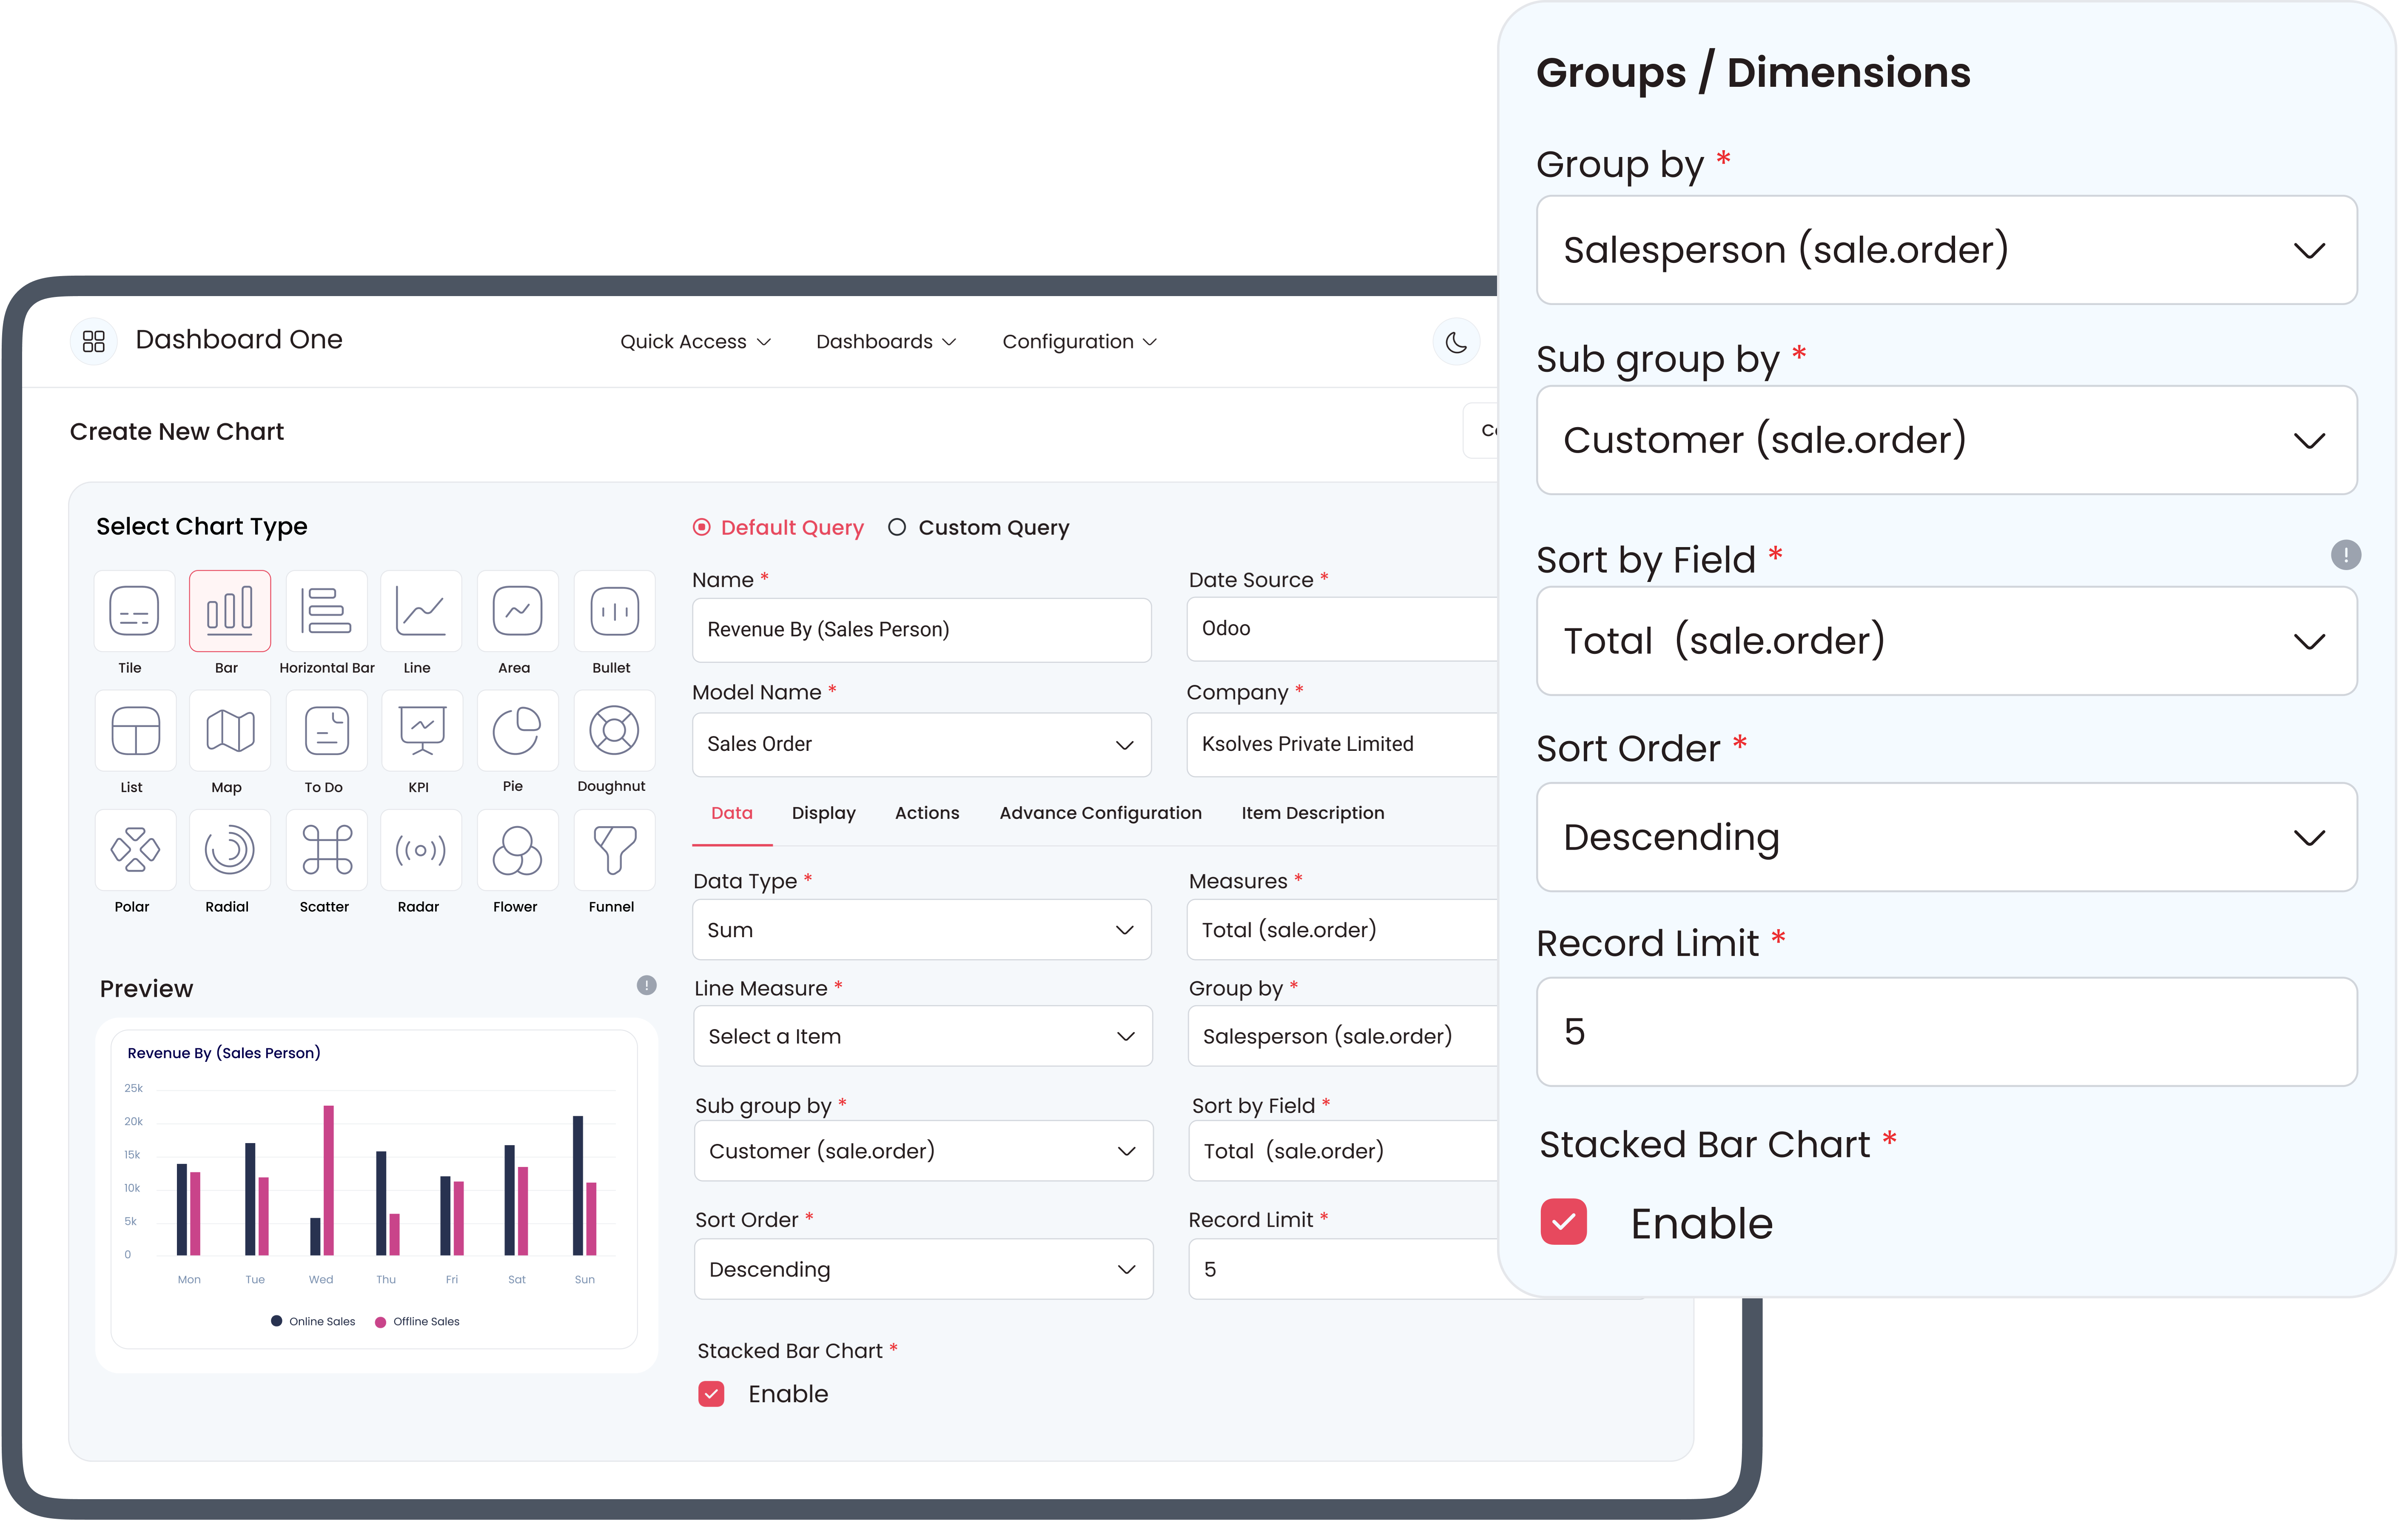
Data Filtration - Group By, Limit & Sort By
Group By, Sort By, Limit, filter condition to get desired data for any dashboard item as per your requirement.
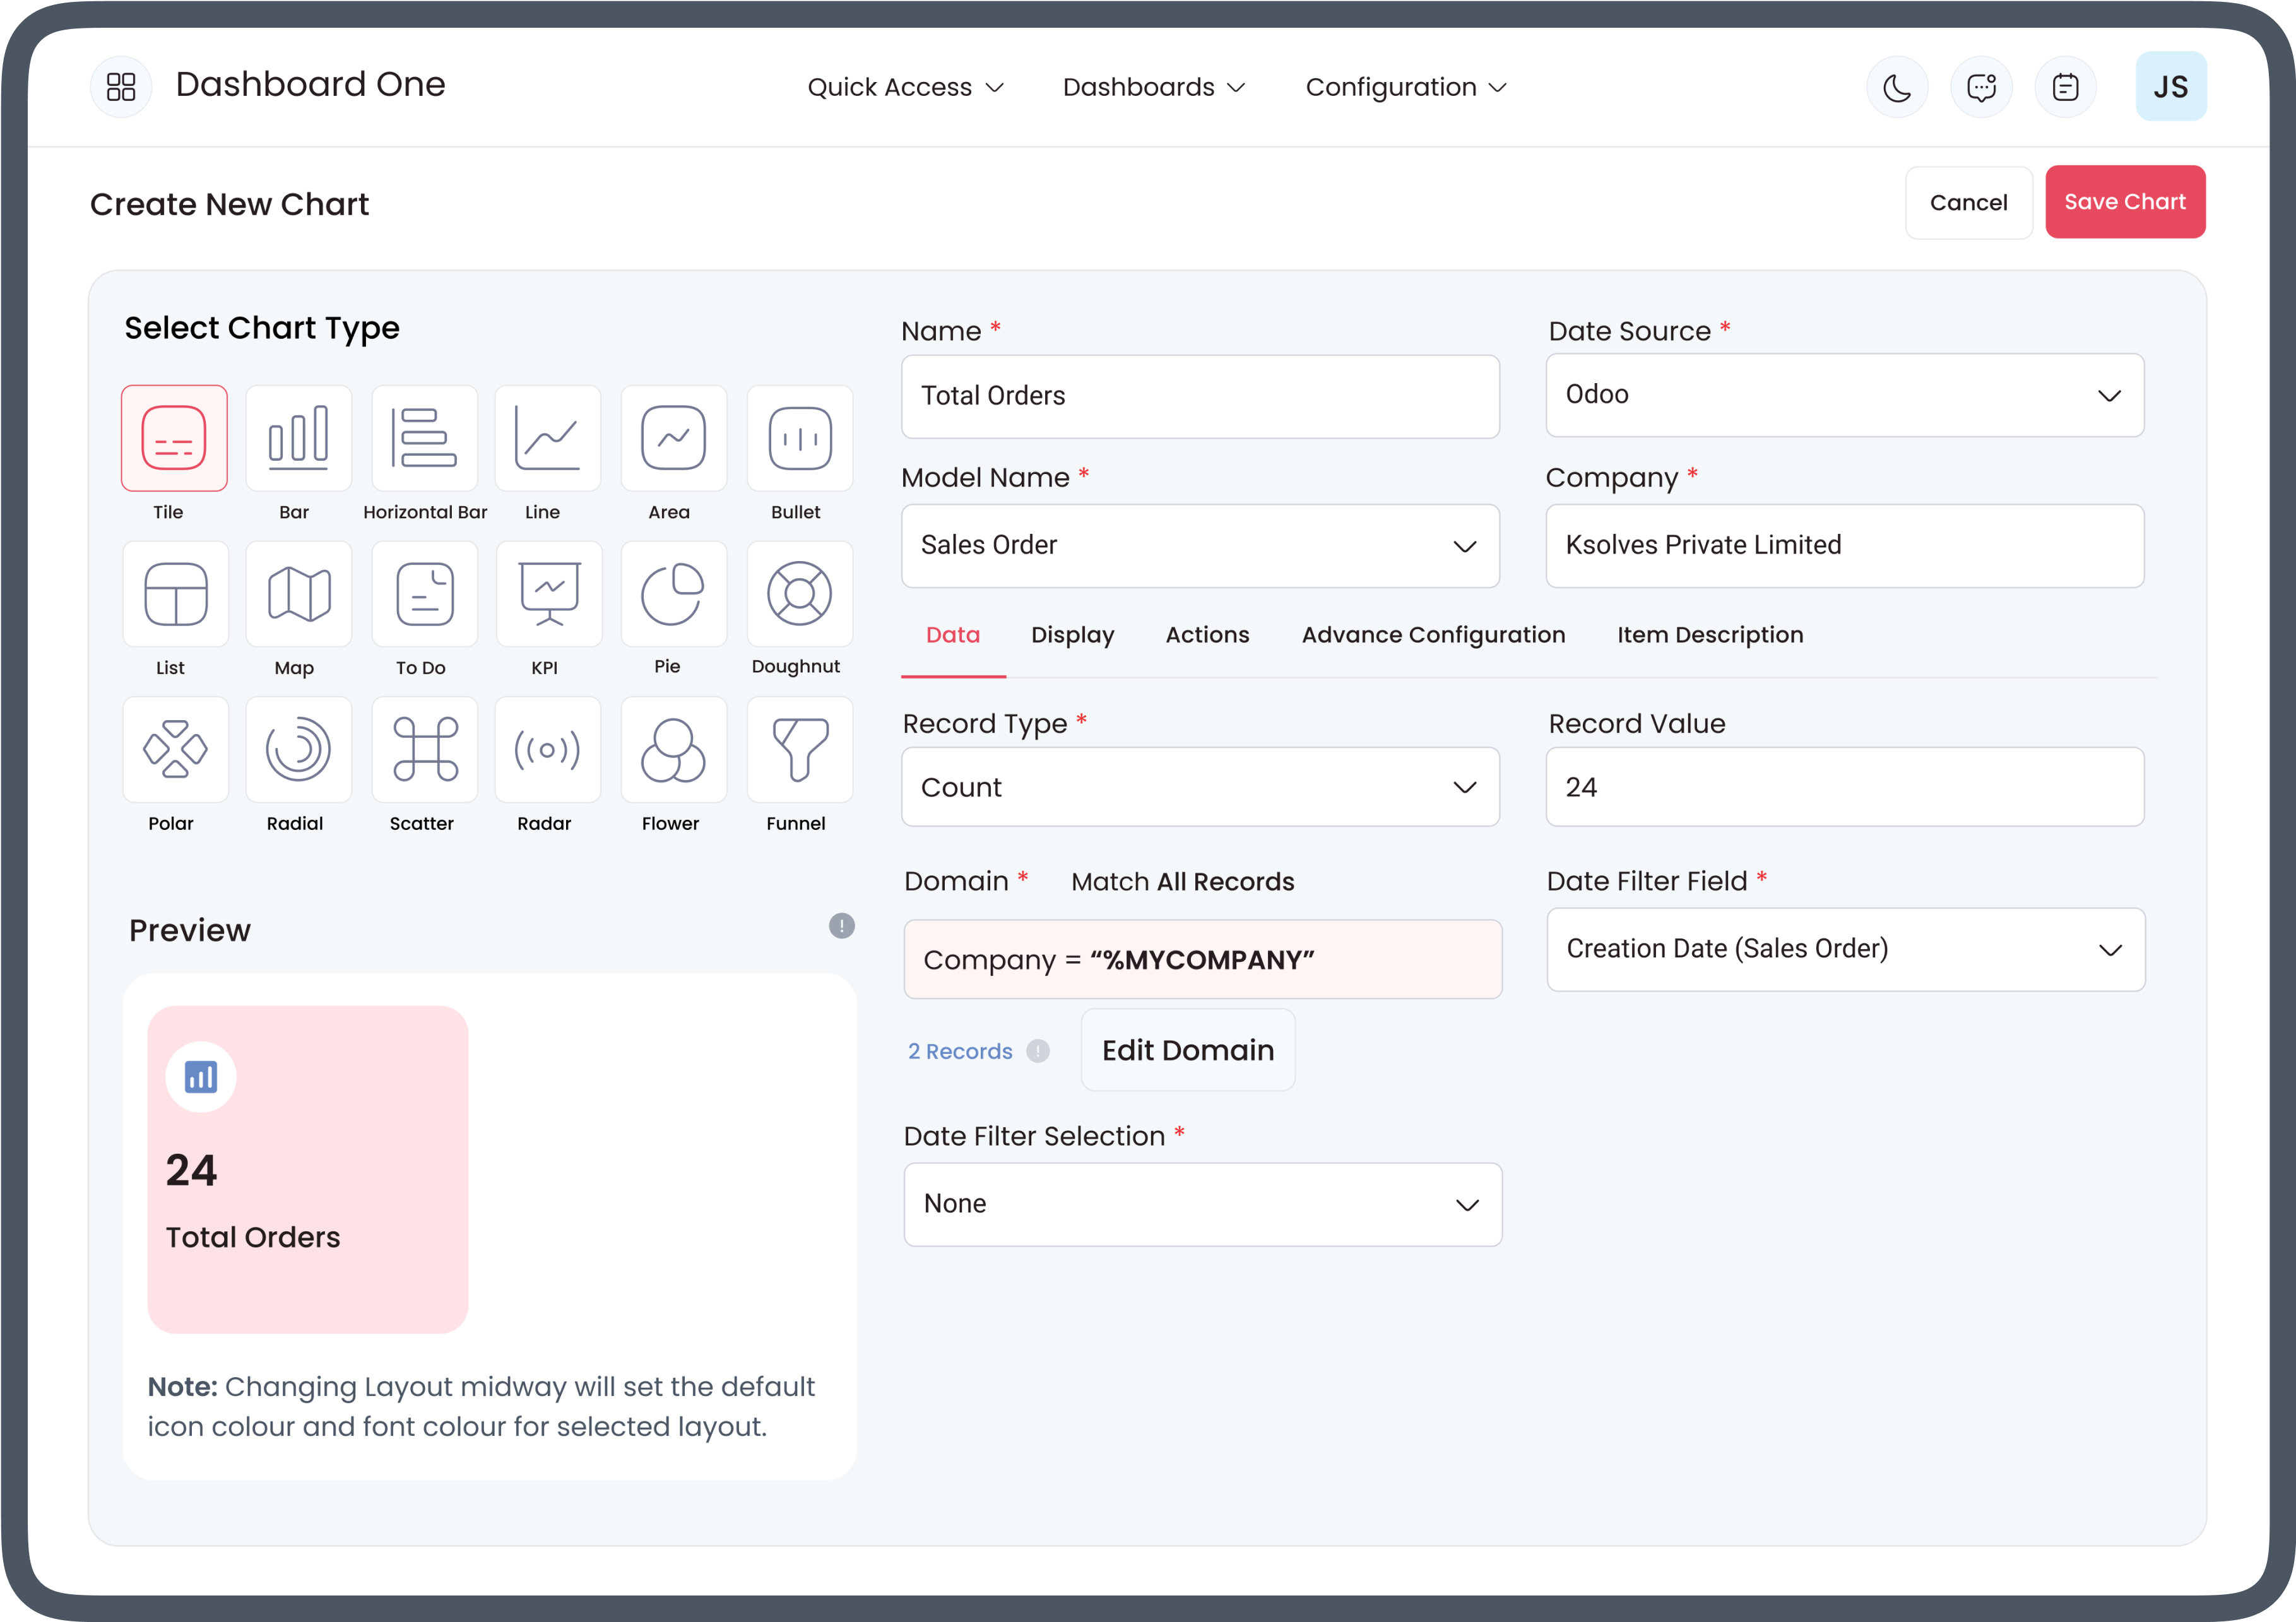
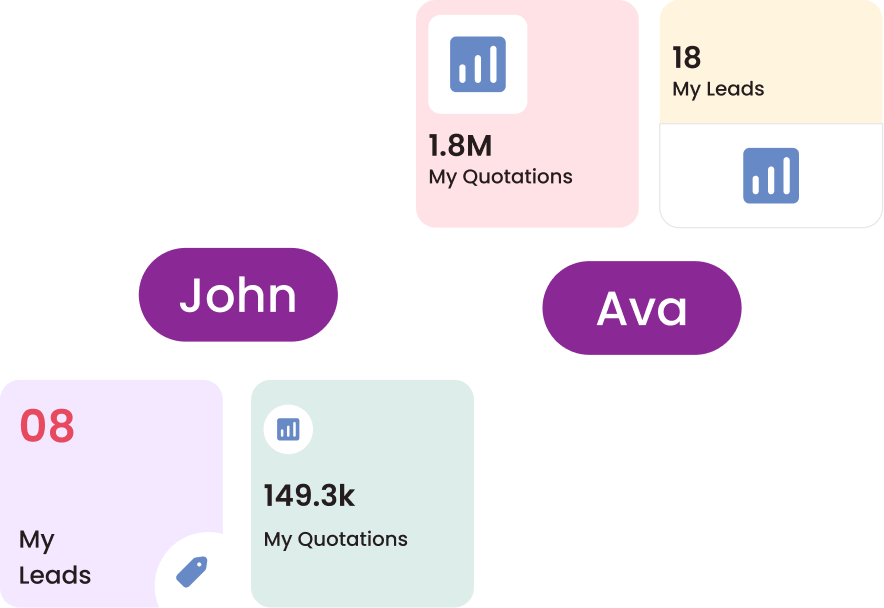
Authentic %MYCOMPANY Filter
Get company-oriented details by filtering the logged-in user data using this dynamic filter.
Unique User ID (%UID)
Filter logged-in user data using %UID in domain filter to see the results related to the logged-in user.
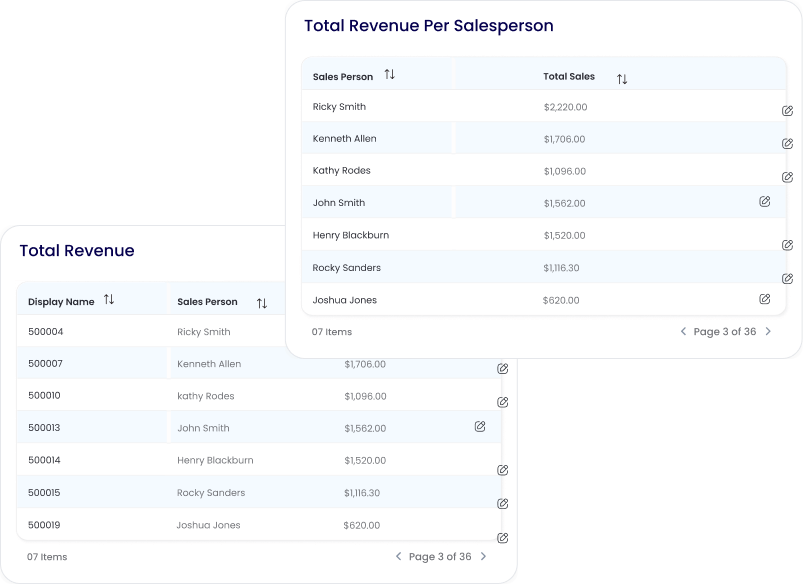
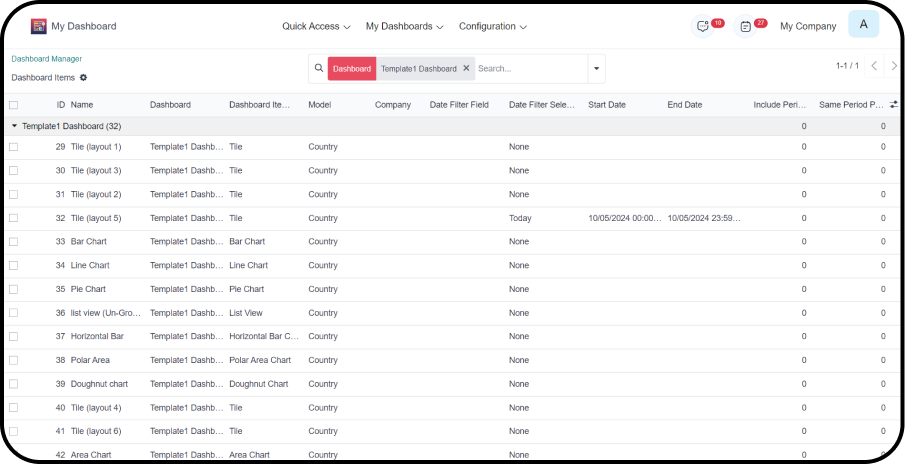
Dashboard Item 2 List View Styles
Use the list-view item to view multi-value data sets in a grouped or ungrouped manner. Example: To see the total sales, average sales, total quotations of the top 10 sales persons.
Design Your Own Dashboard Layout
Design your dashboard layouts by resizing, dragging,
repositioning the dashboard
items, and renaming the dashboard heading for arranging
all items as per your need.
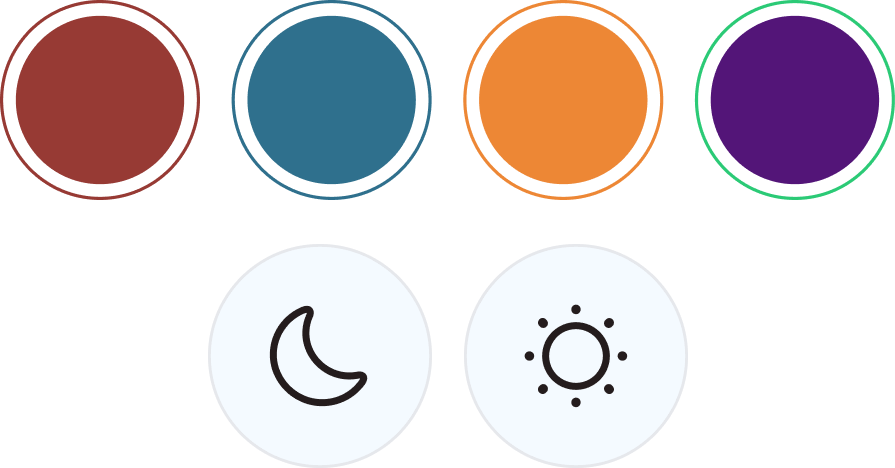
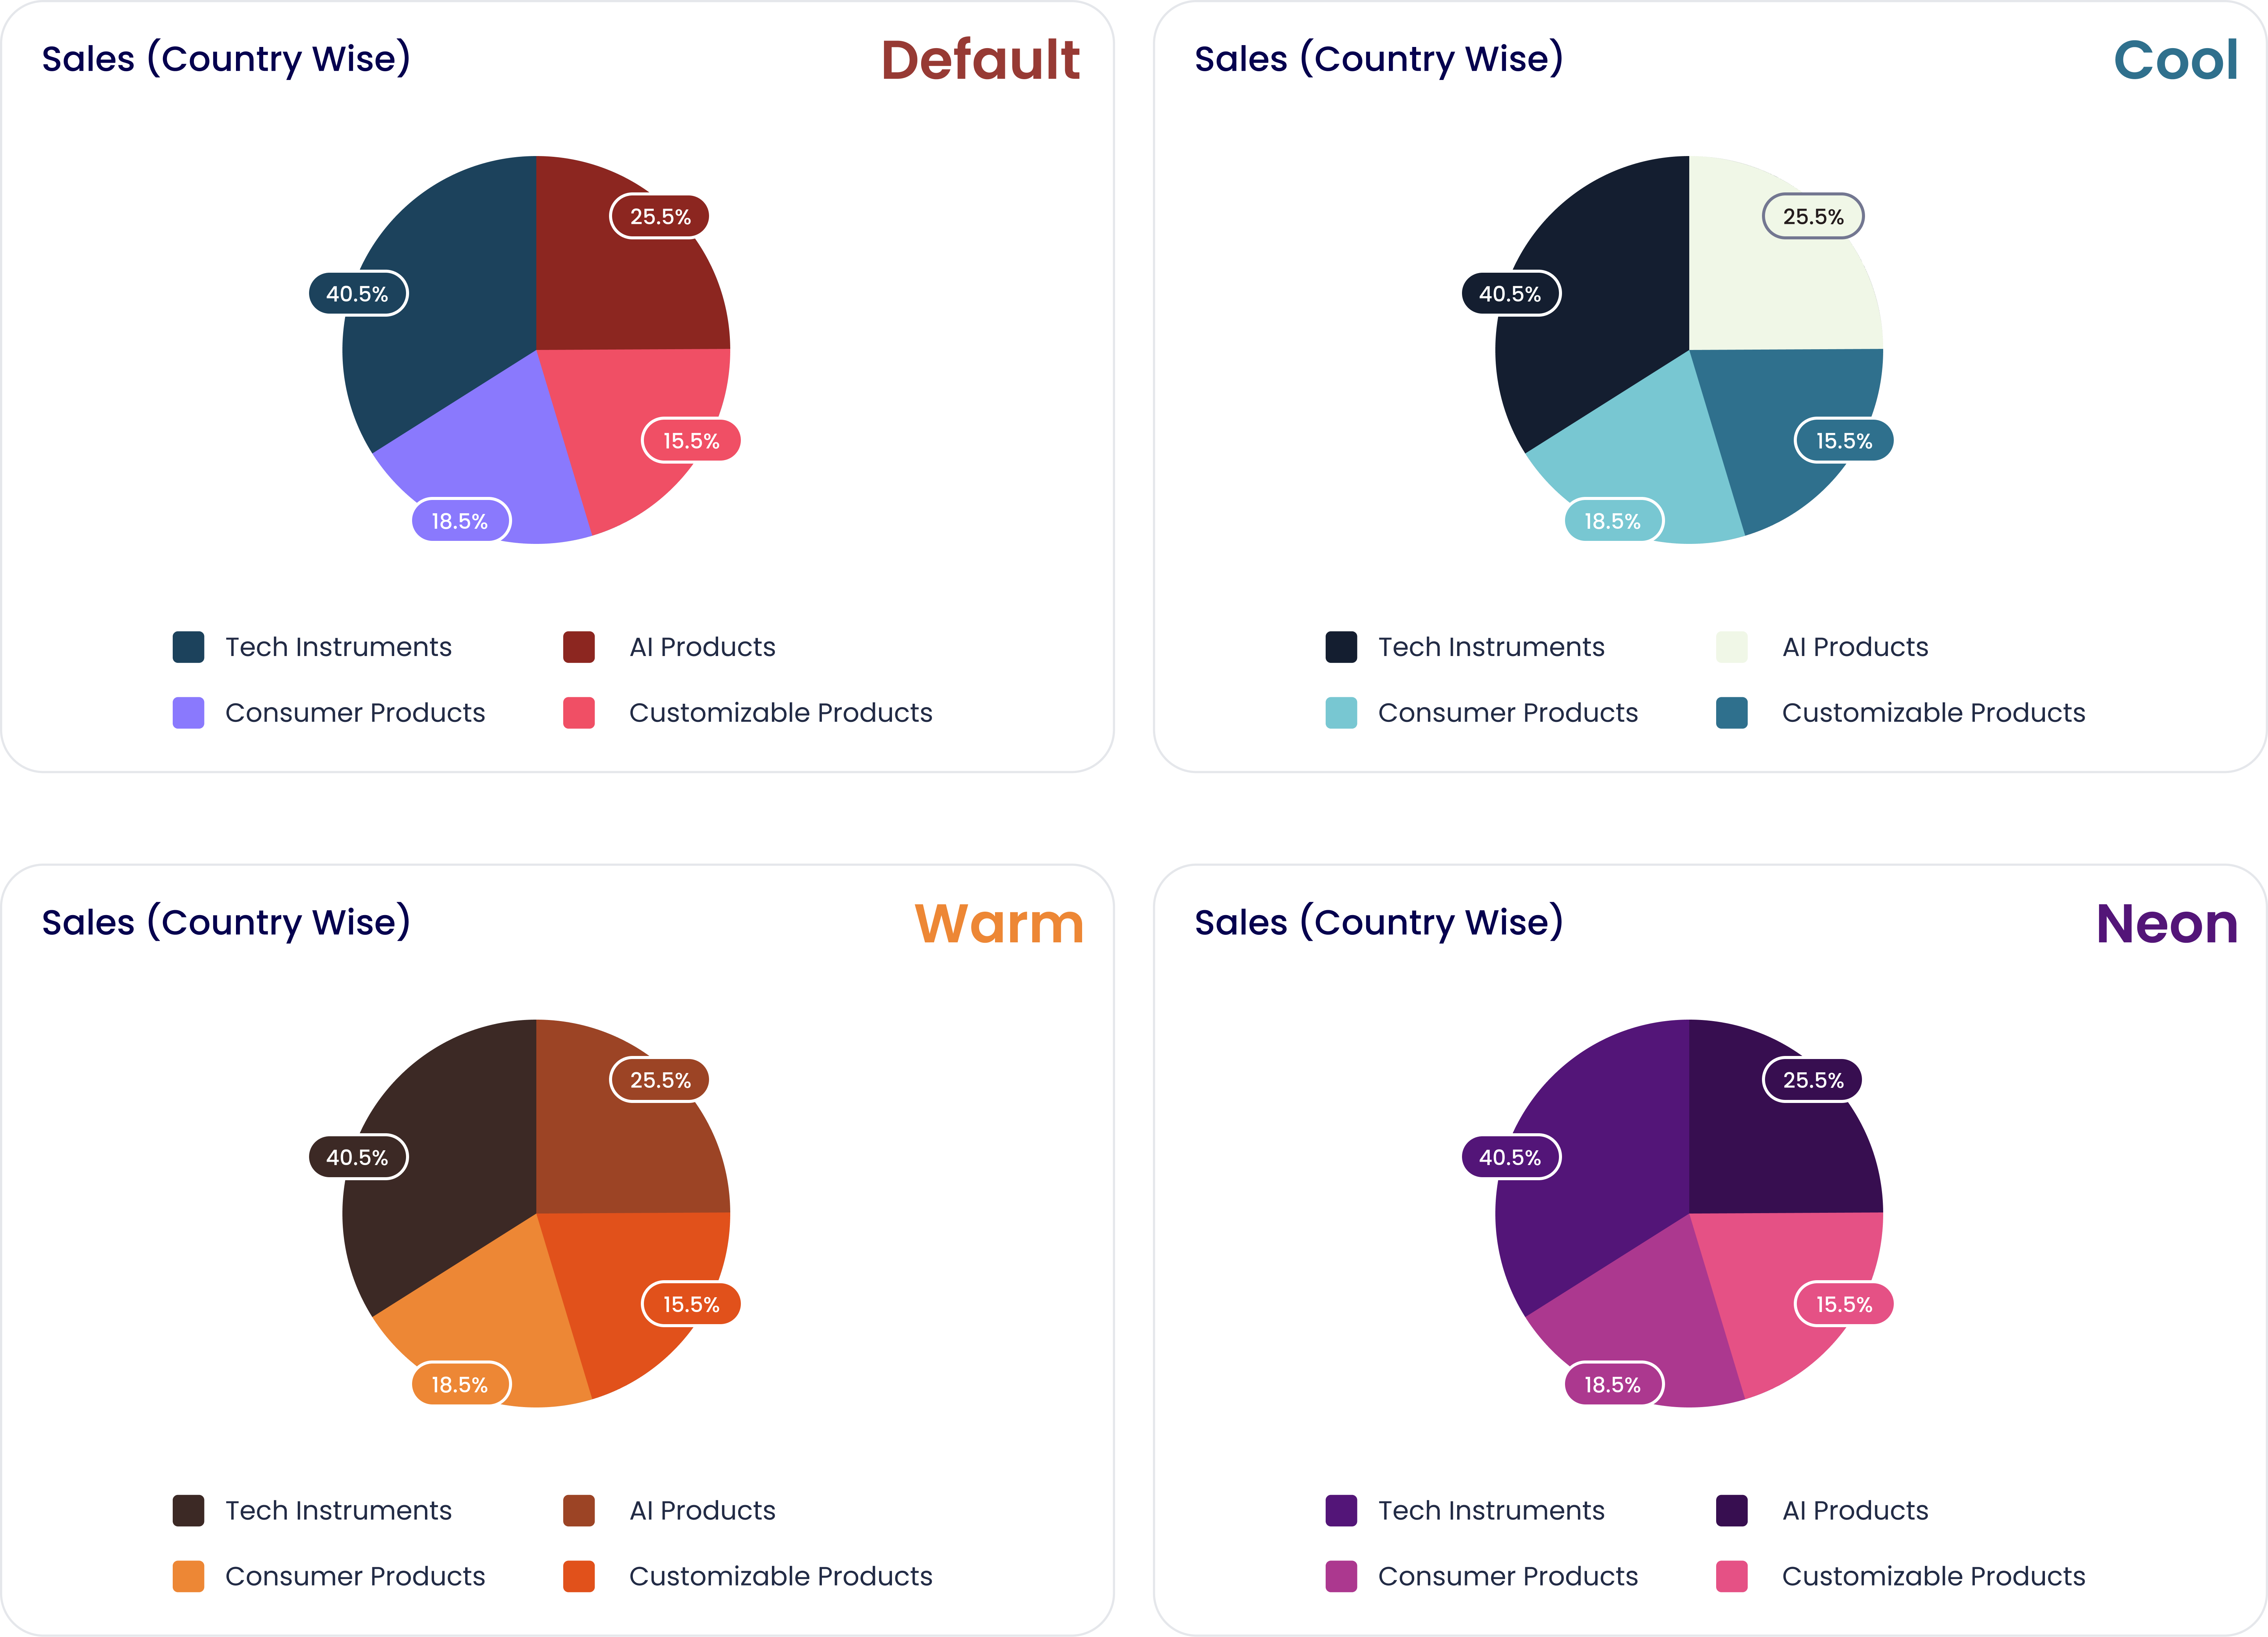
Multi - Color Themes
Beautiful, interactive, and outstanding multi-colored themes can be added to your dashboard.
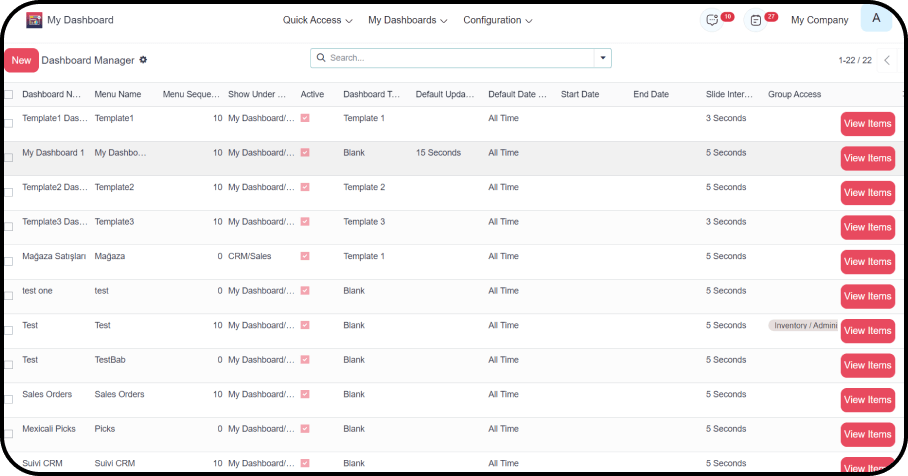
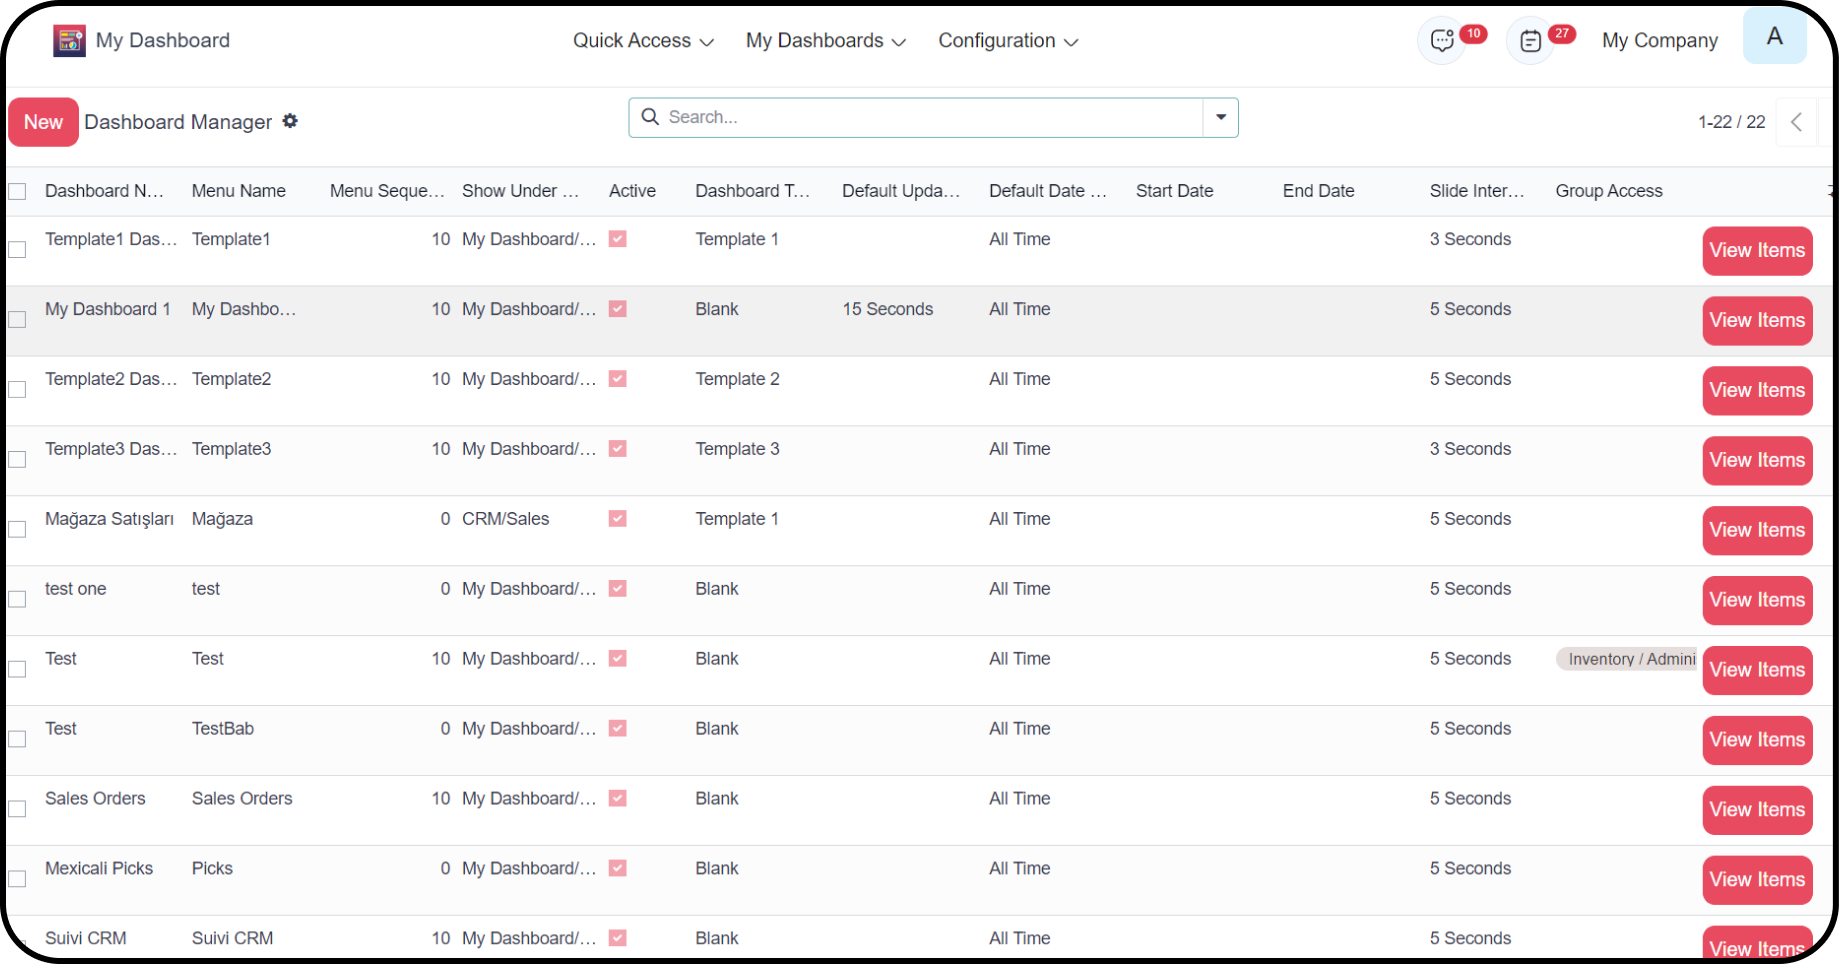
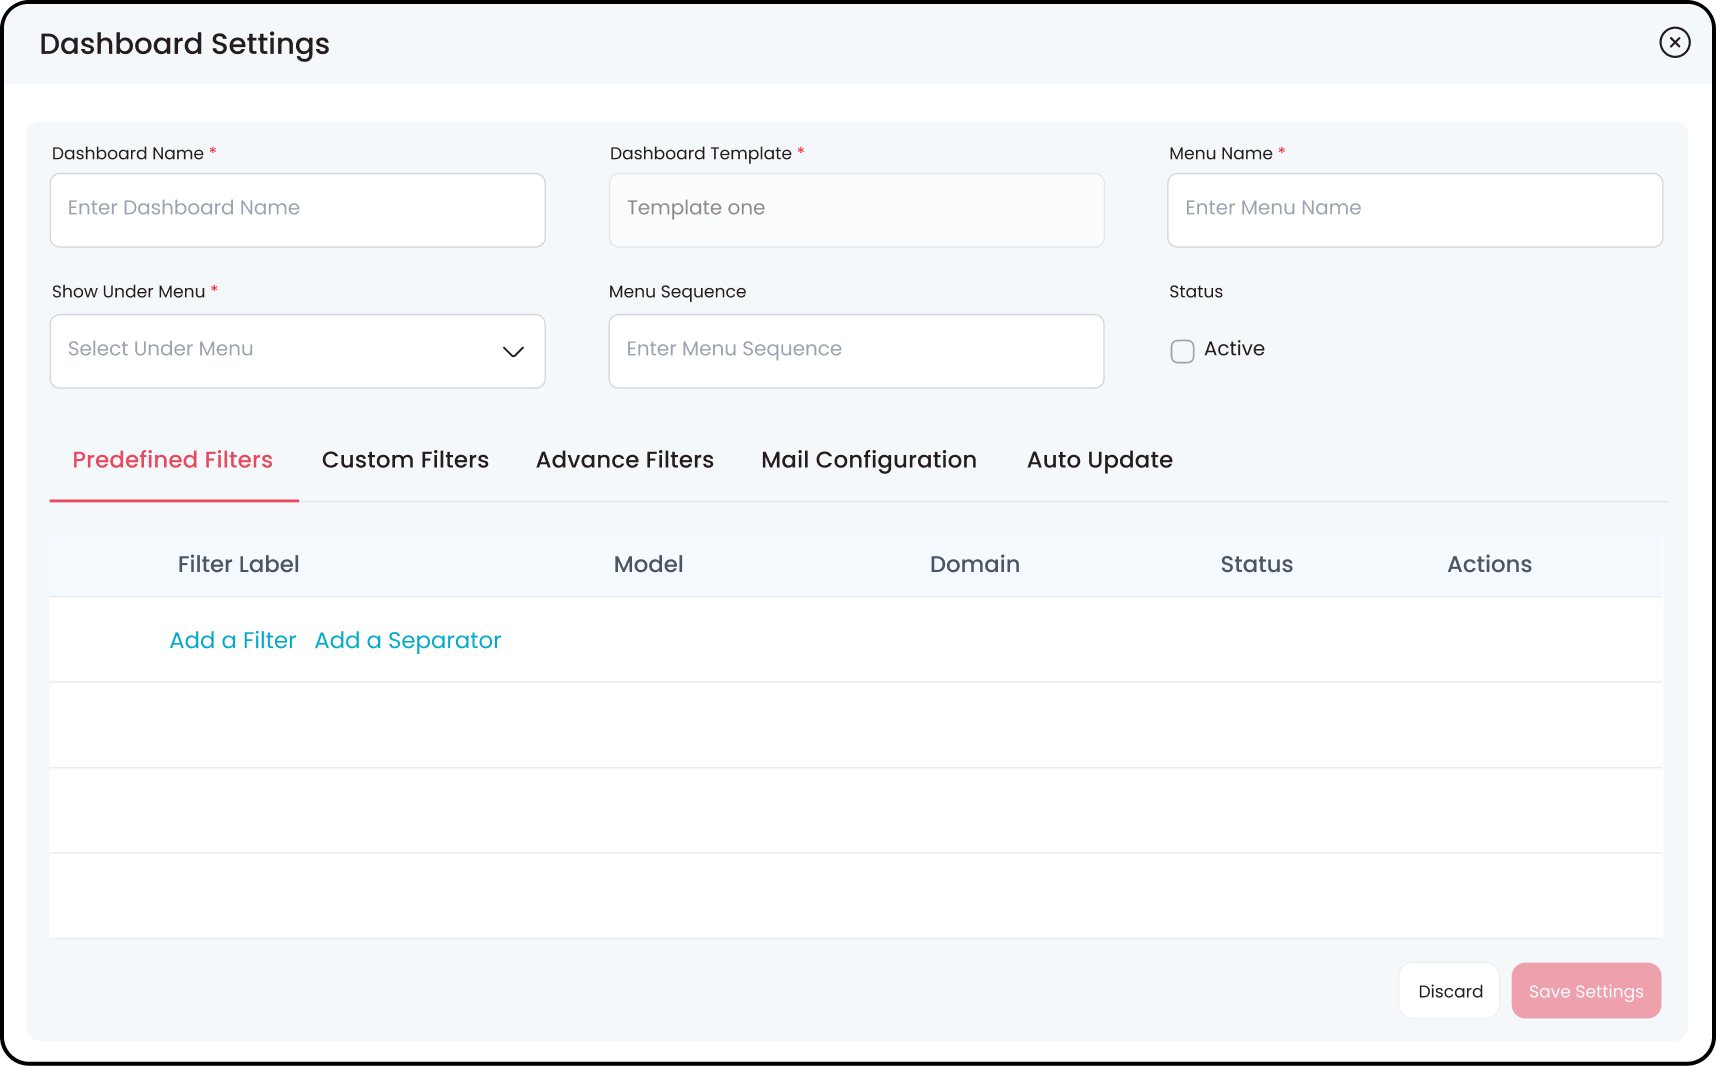
Dashboard Personalization/Configuration
Configure the dashboard name, menu, group access, choose
the sequence,
and more while creating interactive presentable dashboards
for your business.
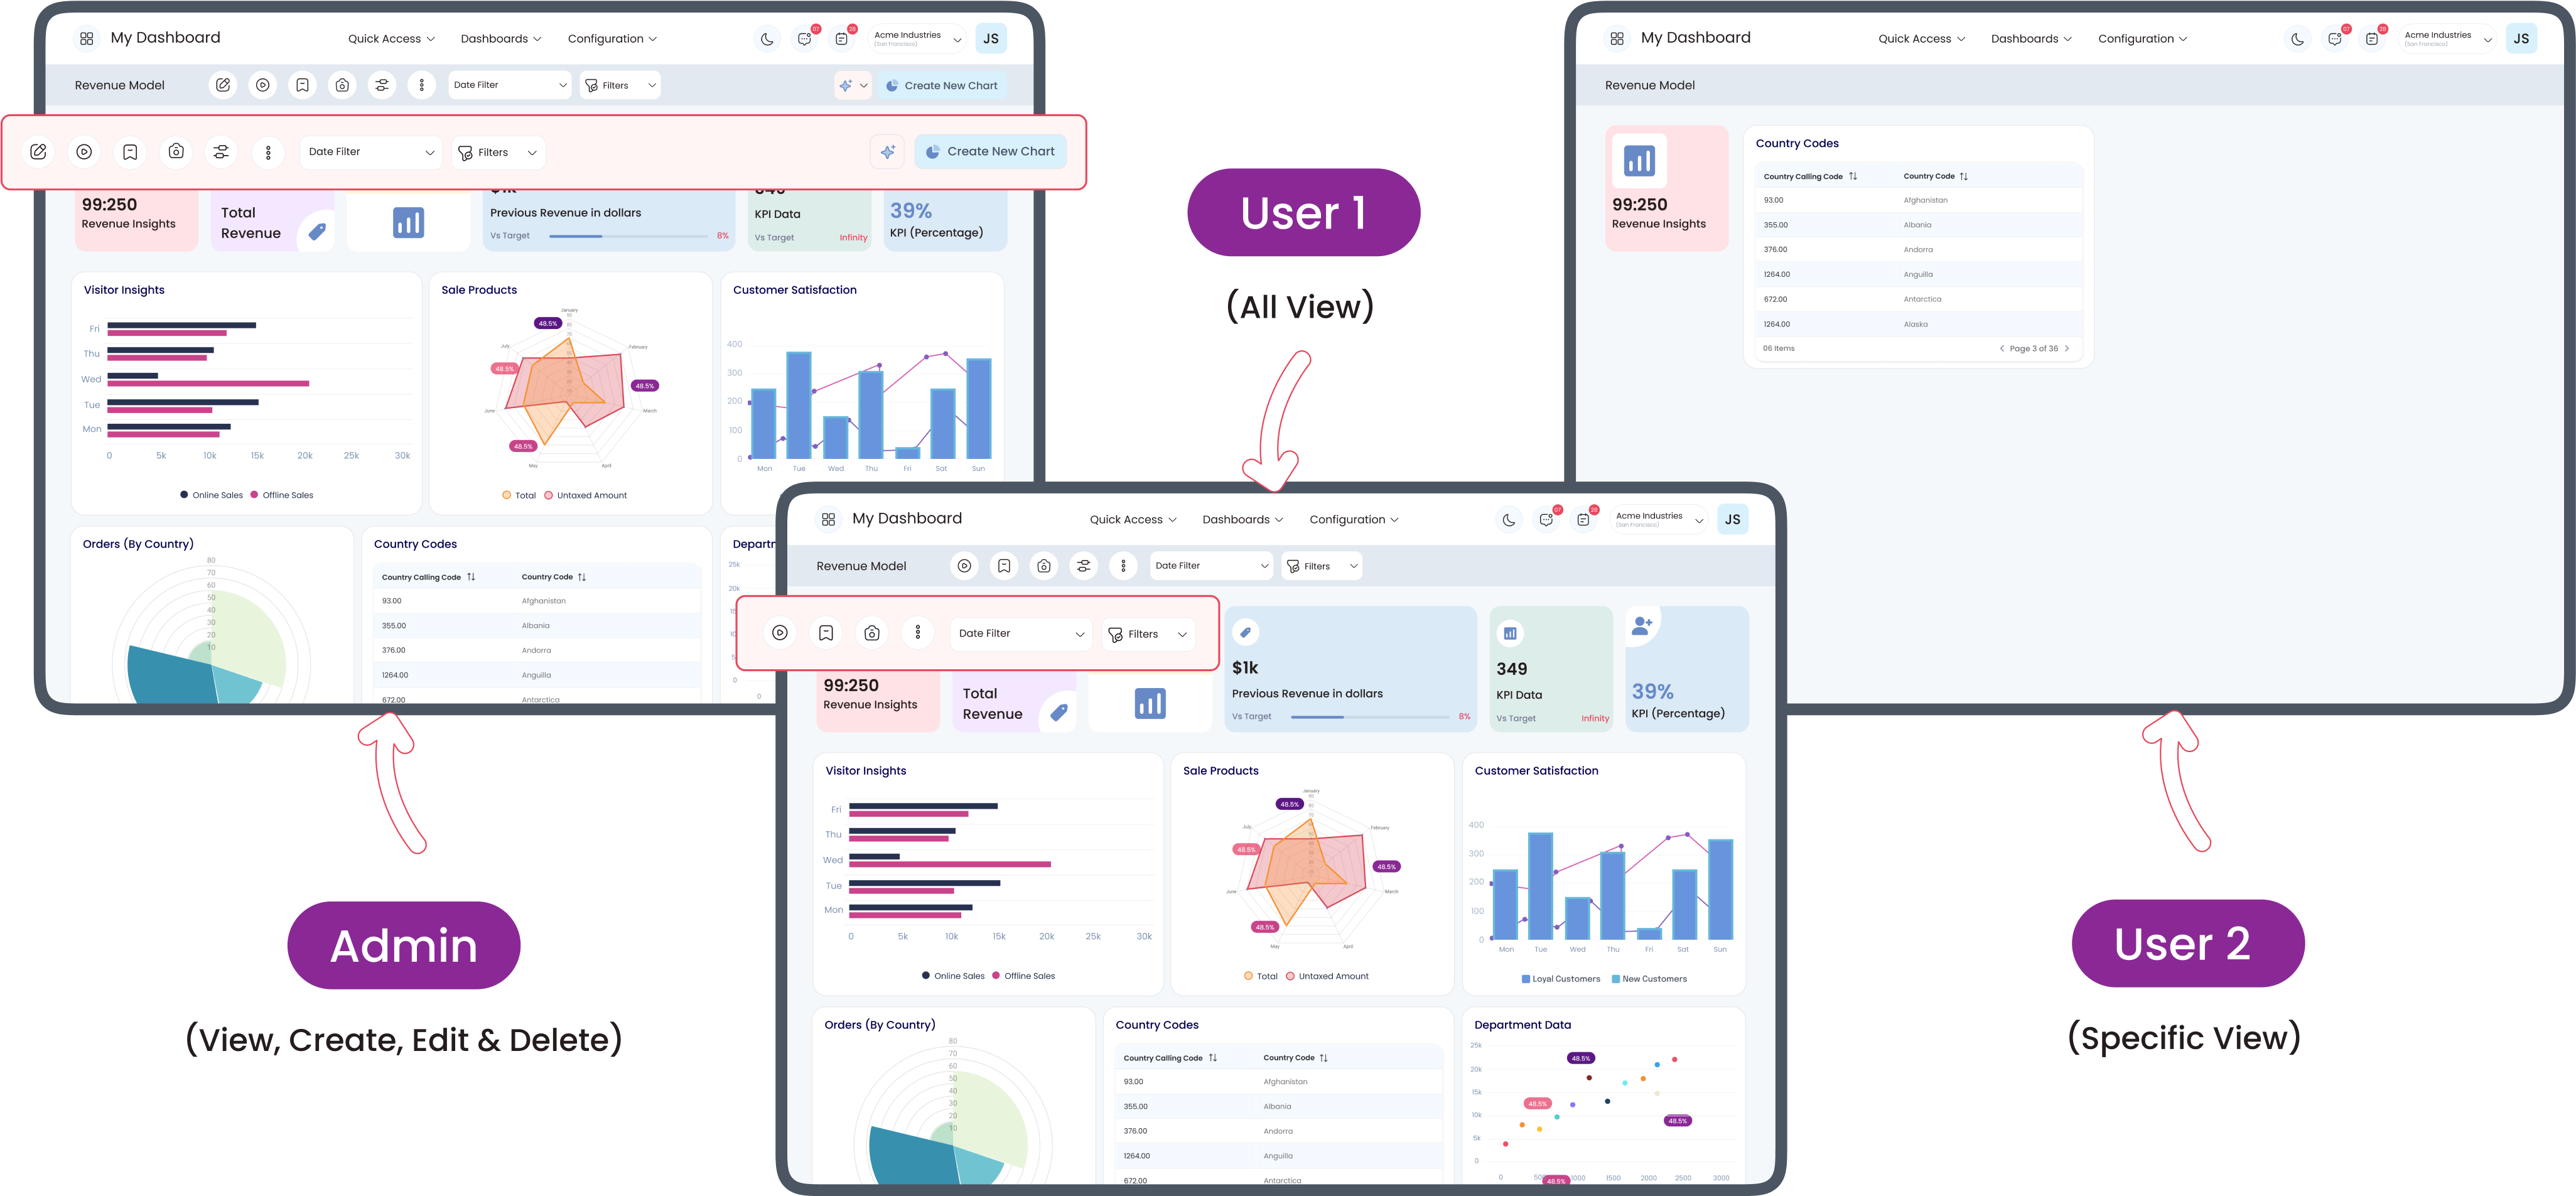
Access Control
Control who can access the Odoo dashboard with a single click for robust security.
Instant Edit Mode
A user can edit the basic information of any dashboard
items instantly with
Quick Edit Mode without going to the detailed edit screen.
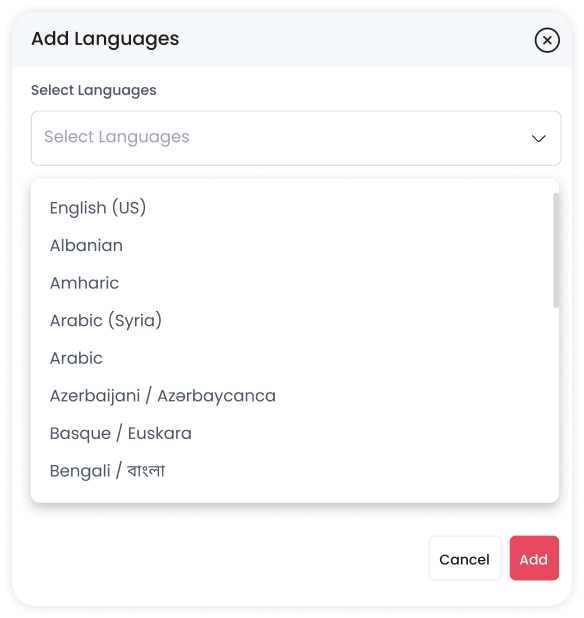
RTL Support
Odoo Dashboard Ninja gives you the freedom to work in
Right-to-Left
language-oriented interface for increasing productivity.
Frequently Asked Questions
Sometimes you need a quick answer to your
question. You can get it right away here.
General
Artificial Intelligence
Please contact us at support@ksolves.com for expert support. We’ll diagnose and restore your Odoo Best Dashboard functionality.
Charts
Data Sources
Filters & Group By
Access Rights
- Yes. After you create a dashboard, an action is generated with the name: Menu Name + “Action”.
- For example, if you create a Project Dashboard, go to User Preferences → Home Action and select “Project Dashboard Action”.
- Easily assign Predefined Dashboards as the default landing view for users.
Dashboard Ninja Releases
Every update brings new capabilities. Keep track of the latest
features and
enhancements designed to visualize and analyze your data like
a pro.

Latest Release 1.1.7 (7th April, 2025)
- Fixed bugs regarding the Sub Group By & Sort By Field and kpi.
- Fixed bugs regarding the Data Calculation Type.
Release 1.1.6 (3rd April, 2025)
- Fixes: Fixed bugs regarding the list views and kpi.
Release 1.1.5 (04th March, 2025)
- Improved chart interaction: Clicking on a chart with a sub-group applied now displays only the relevant sub-group data.
Release 1.1.4 (14th February, 2025)
- New Chart Filter Feature.
Release 1.1.3 (10th February, 2025)
- Code restructured based on owl components and code break fixes.
Release 1.1.2 (03rd February, 2025)
- Fixed the issue when creating charts with Excel and CSV.
Release 1.1.1 (30th January, 2025)
- Bug Fix in Sorting of list charts.
Release 1.1.0 (23rd January, 2025)
- Filters optimisation and bug fixes.
Release 1.0.9 (14th January, 2025)
- Removed the warnings from logs.
Release 1.0.8 (6th January, 2025)
- Improved the Dashboard Ninja compatibility with ARC theme
Release 1.0.7 (31st December, 2024)
- Improved the Dashboard Ninja compatibility with ARC theme
Release 1.0.6 (26th December, 2024)
- Updated the AI server url
Release 1.0.5 (17th December, 2024)
- Fixed the code break when changing the dashboard data.
Release 1.0.4 (14th December, 2024)
- Client action removed.
Release 1.0.3 (12th December, 2024)
- New theme navbar removed.
Release 1.0.2 (09th December, 2024)
- Resolved the x-axis label formatting issue in the bar chart when grouping by a datetime field with subgroup.
Release 1.0.1 (03rd December, 2024)
- Bug Fixes and Improvements in UI.
Release 1.0.0 (21st October, 2024)
- Latest Version 18 Release of Dashboard Ninja With AI.